Delivered engineering systems spanning automation, environmental telemetry, custom platforms, and mission-critical field operations.
A real-time species recognition and automated gate control system for feral animal management across Australian pastoral properties.
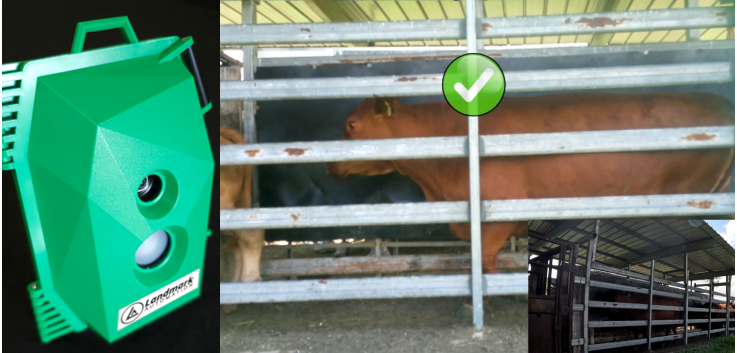
Landmark Automation engaged Reid Automation Systems to develop the complete software framework for SmartGate — a system combining rugged cameras with machine vision to control access to fenced areas on pastoral properties across Australia.
The platform performs real-time species identification, automatically opening or closing gates to protect water resources and manage grazing pressure. Designed for solar-powered, off-grid deployment in harsh outback conditions.
Our scope covered the full software stack: camera integration, real-time classification pipeline, gate control logic, remote monitoring interface, and field device communication protocol.
TerraNode is a solar-powered remote environmental monitoring system for places where the grid and fibre never reach. Each site runs autonomously on MPPT-managed solar, connects over cellular (3G / 4G), and captures a continuous picture of what is happening above and below the ground — from weather through to soil and hydrology — then ships that picture to the cloud in a way that survives patchy coverage and long offline windows.
In the field, TerraNode records weather phenomena on a regular cadence while profiling the subsurface in depth: soil moisture, electrical conductivity (EC), and temperature are sampled at many distinct levels below the surface so vertical structure — how wetness, salinity, and heat move through the profile — can be resolved over time. Parallel channels cover rainfall and runoff behaviour, including temperature, EC, pH, volume, and related indicators, alongside other site-specific hydrology and water-quality inputs.
All of this data is cached locally on the controller and posted to the cloud on a disciplined schedule. Across a fleet, many TerraNode systems operate in parallel; the backend aggregates, time-aligns, and processes those streams so operators see a coherent estate view — not a pile of disconnected CSV drops.
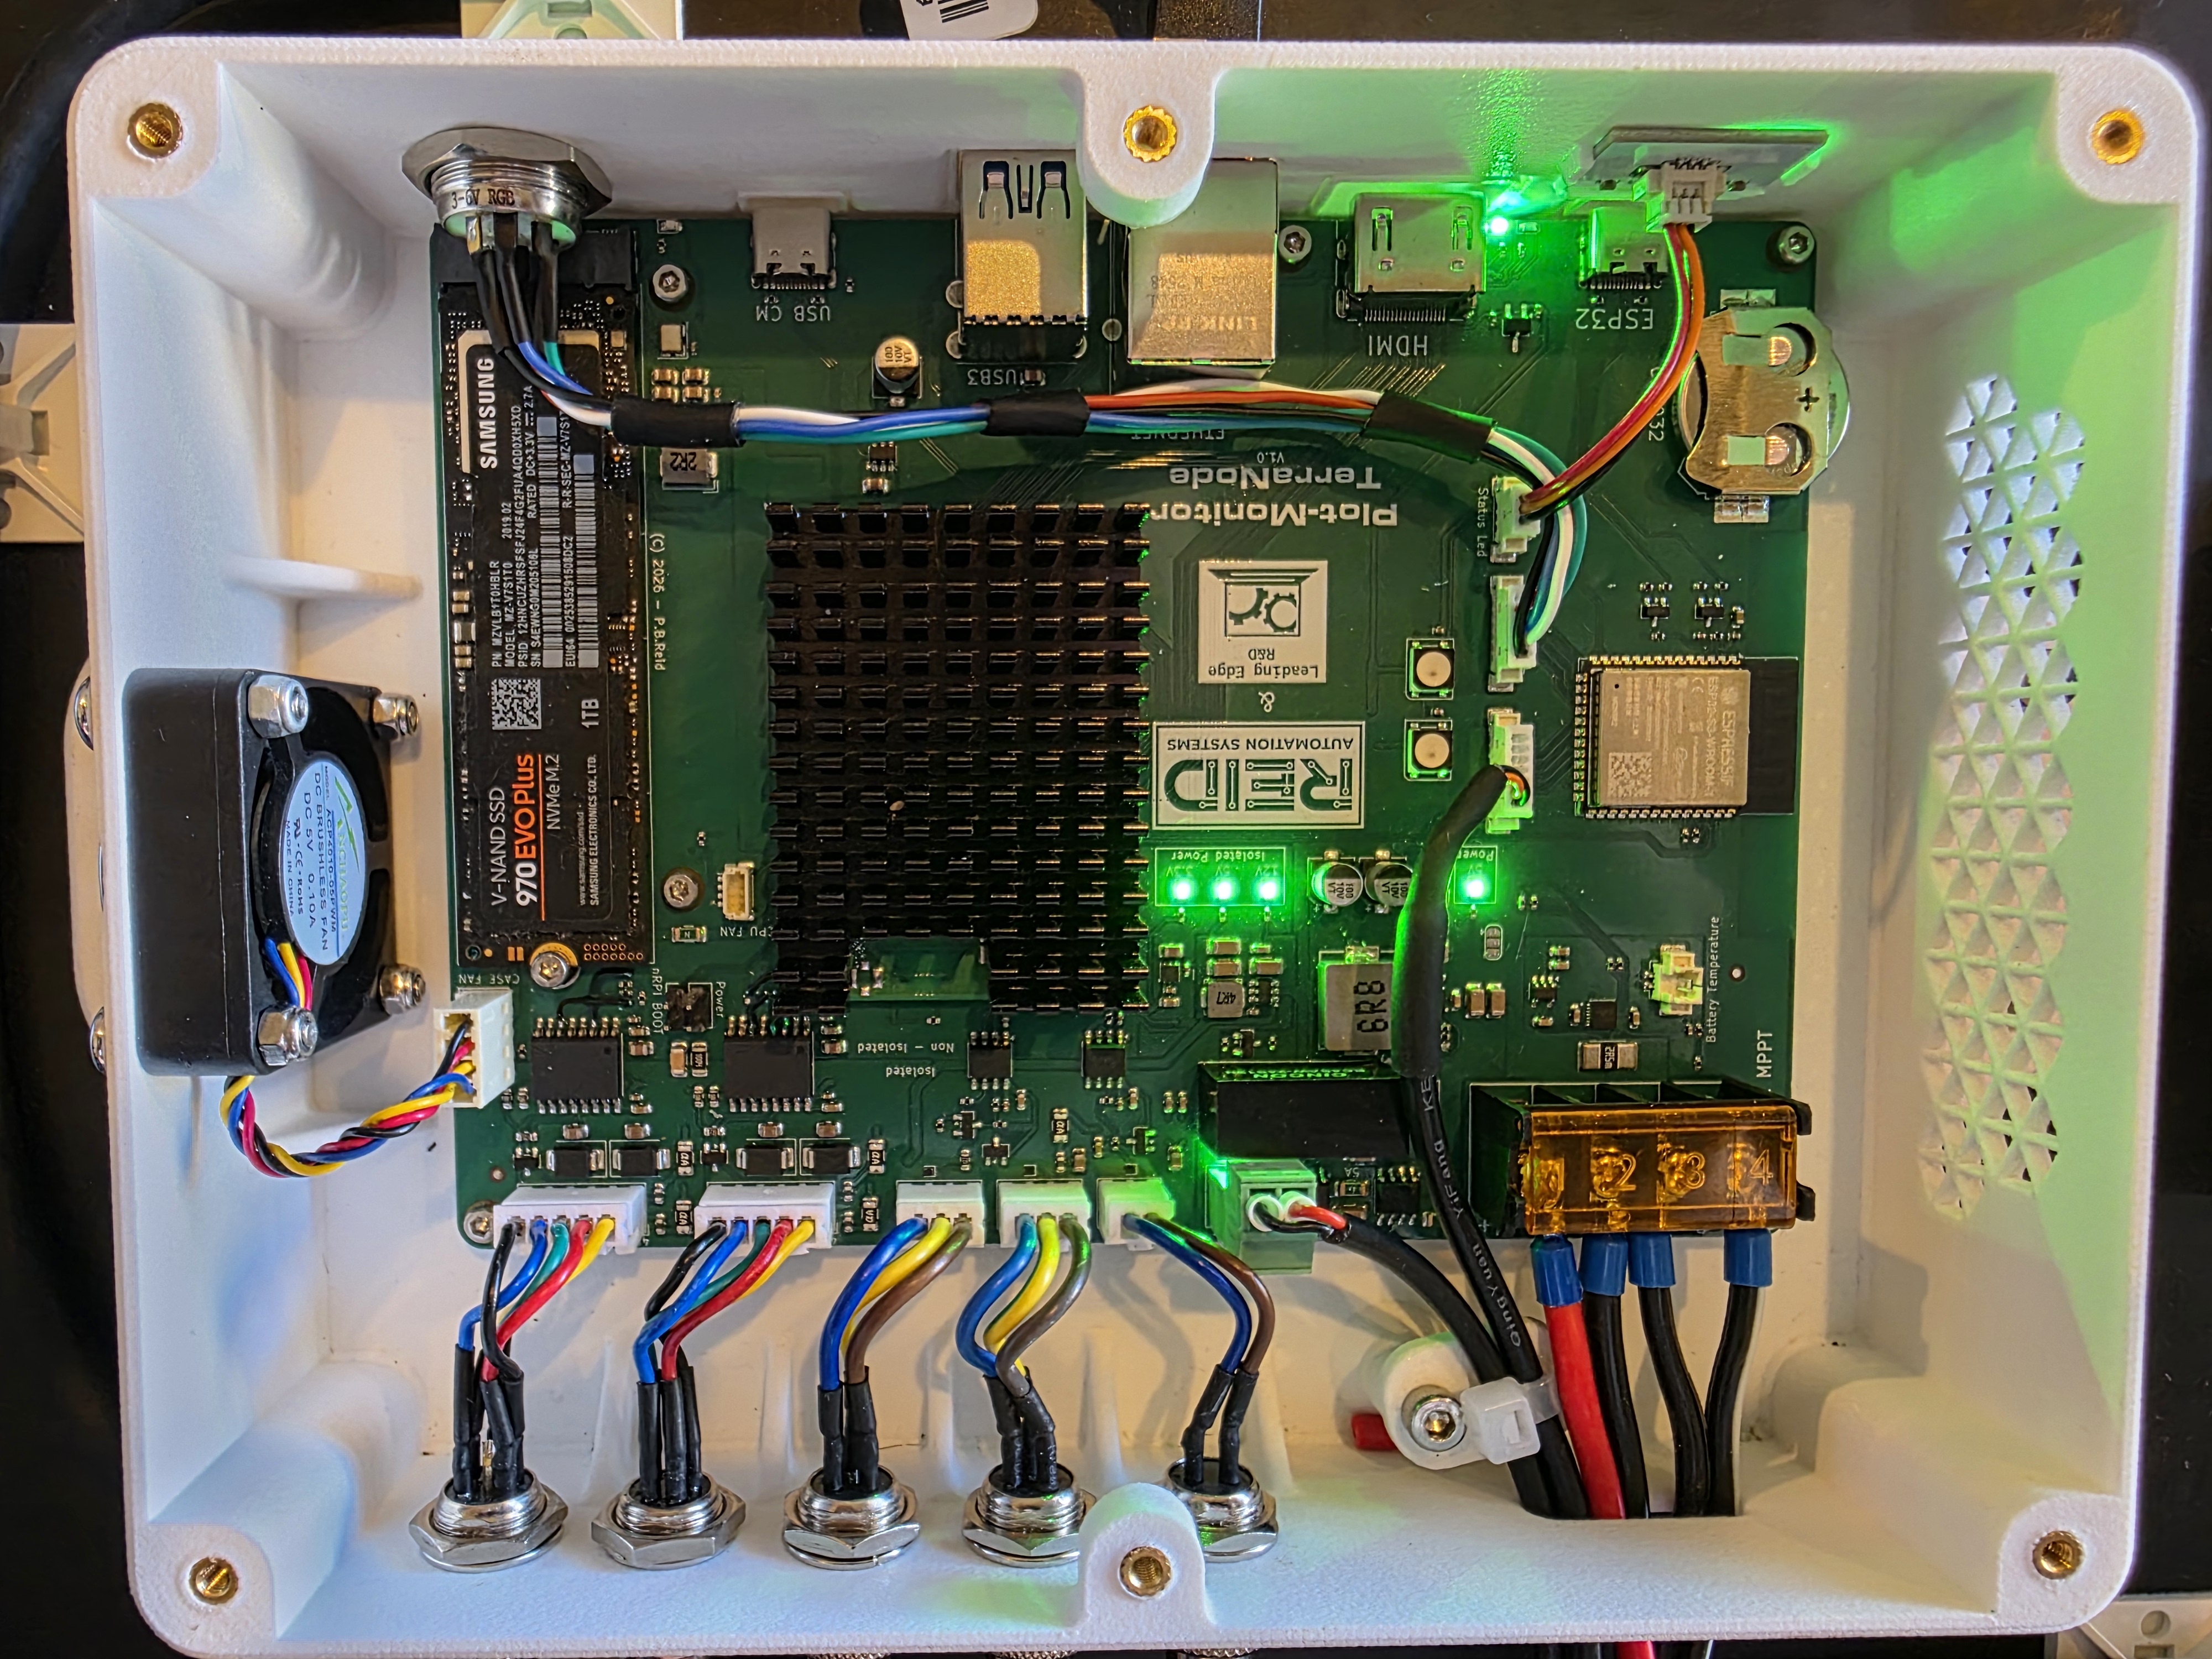
The platform spans the full vertical — custom hardware, embedded Linux, TimescaleDB-backed cloud services, and operator-facing web software — designed and built end-to-end by Reid Automation Systems. The field unit centres on a custom interface board with an ARM Cortex-A76 quad-core Linux host, a dedicated co-processor for real-time sensor I/O, integrated MPPT solar charging, 3G / 4G LTE modem, 1TB NVMe for buffering and media, and a weatherproof enclosure built for years outdoors.
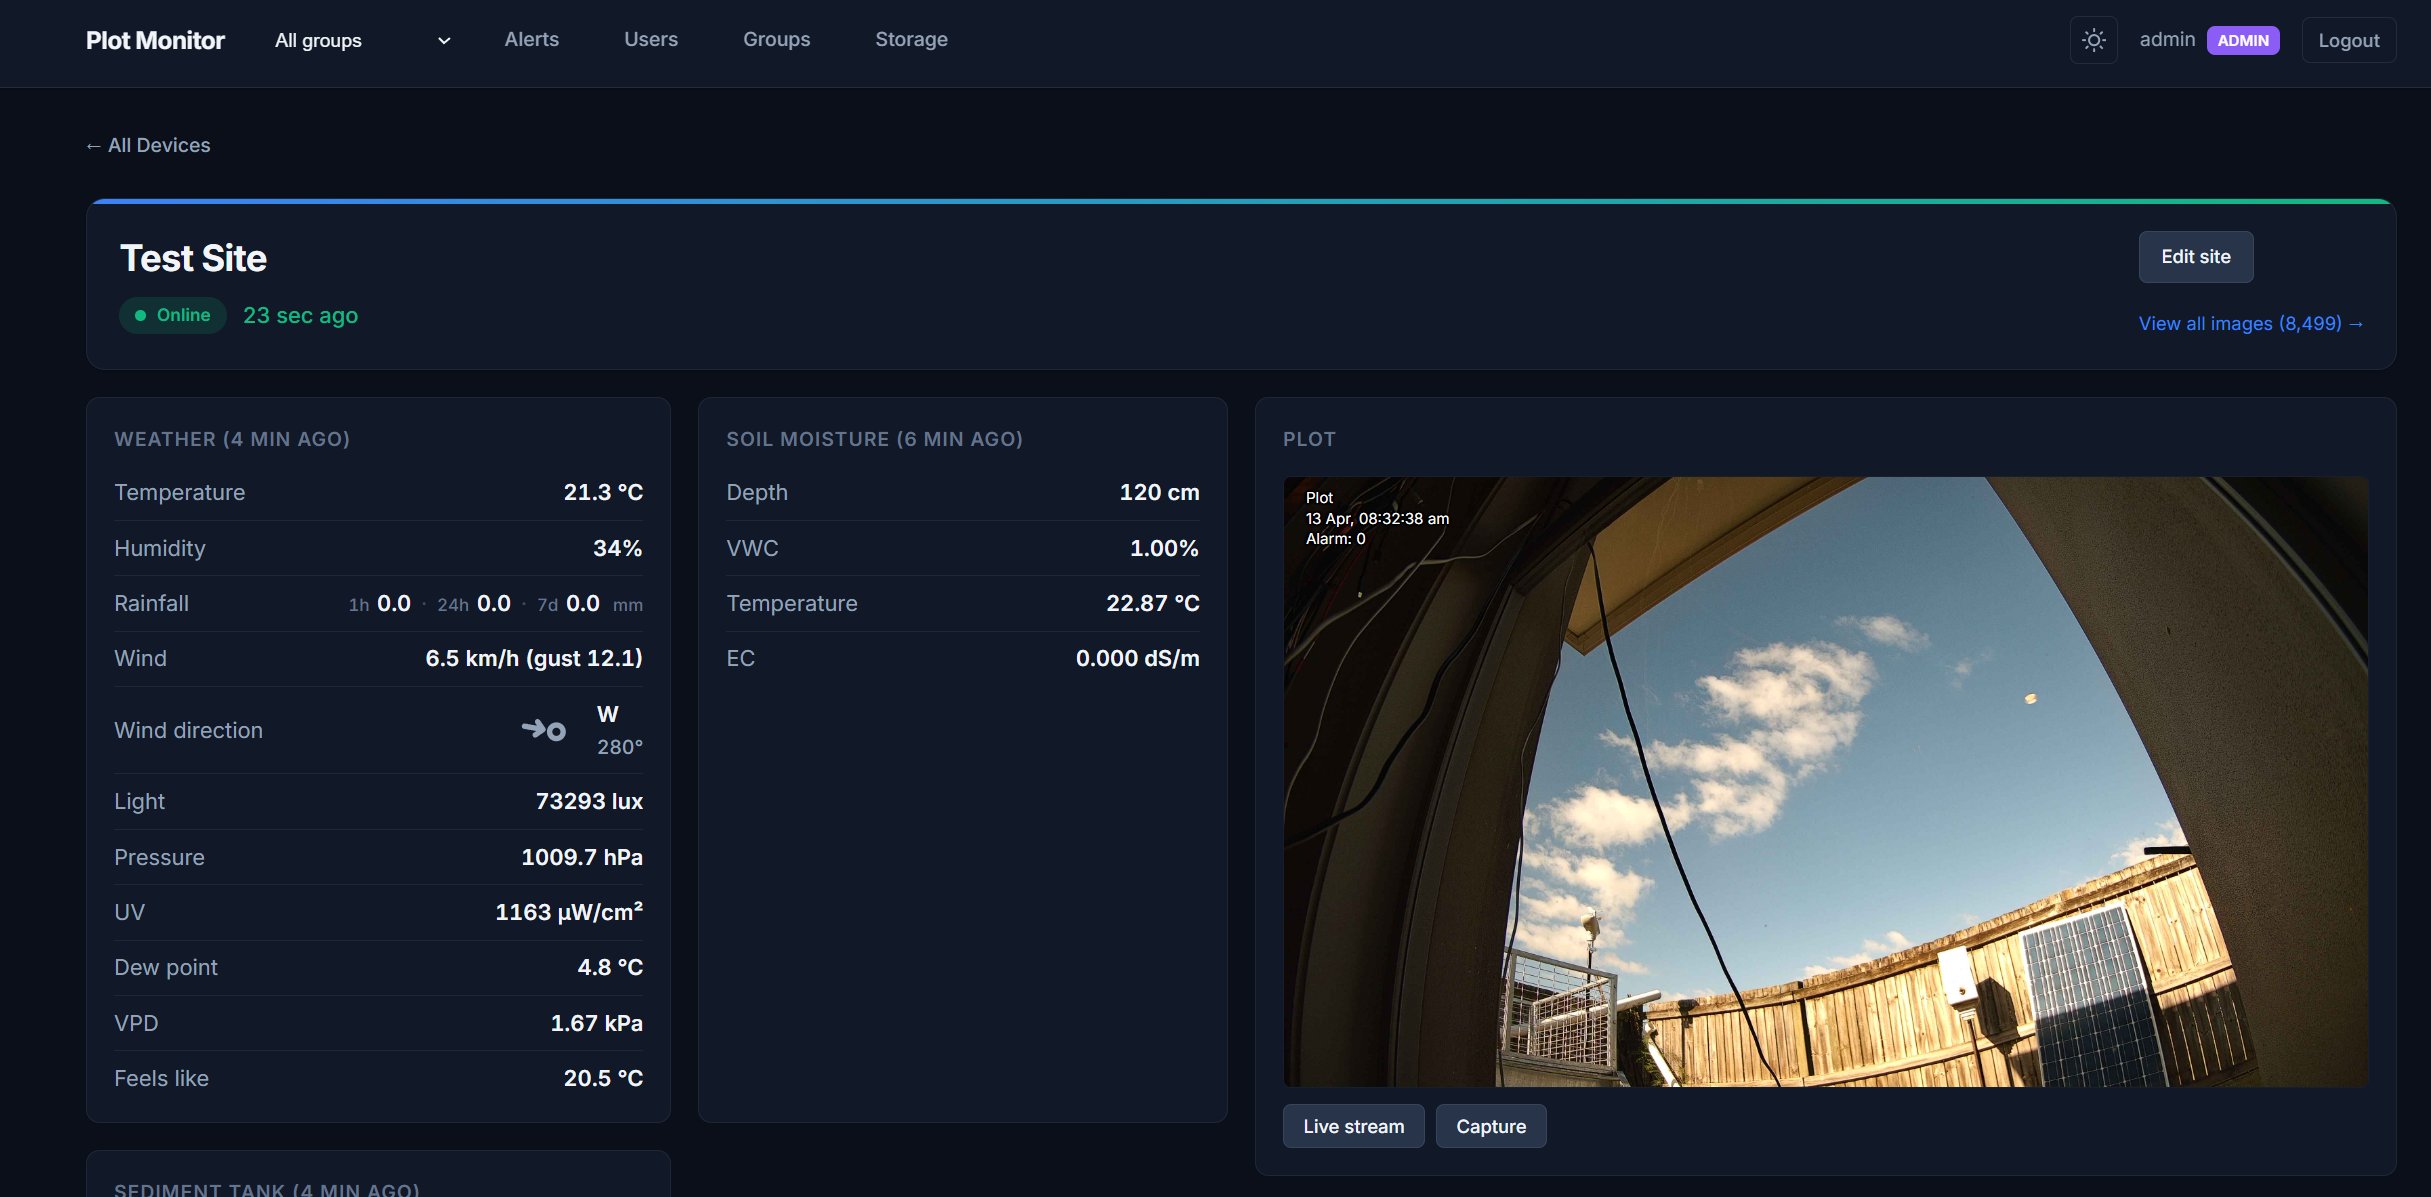
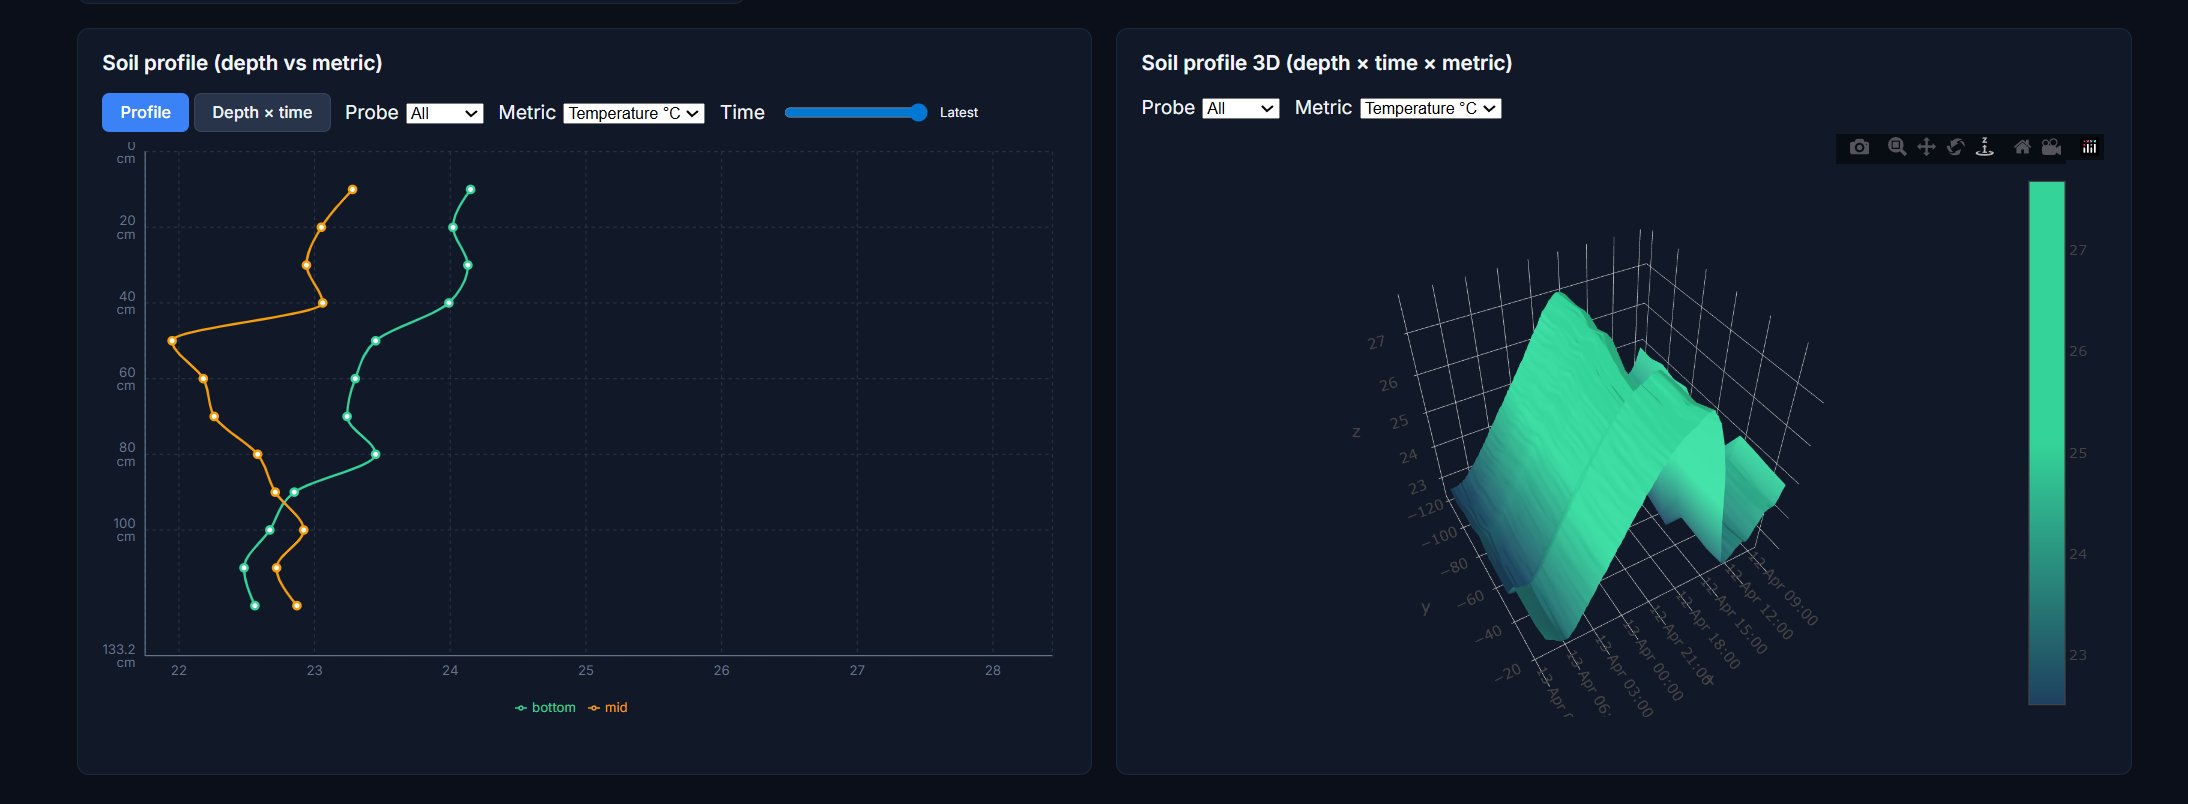
The operator console is a React application with per-site dashboards: live readings, configurable trend charts from one hour to one year, and rich soil visualisation — including interactive 3D surfaces of temperature, moisture, and conductivity across depth and time — so subsurface dynamics read as intuitively as a weather map.
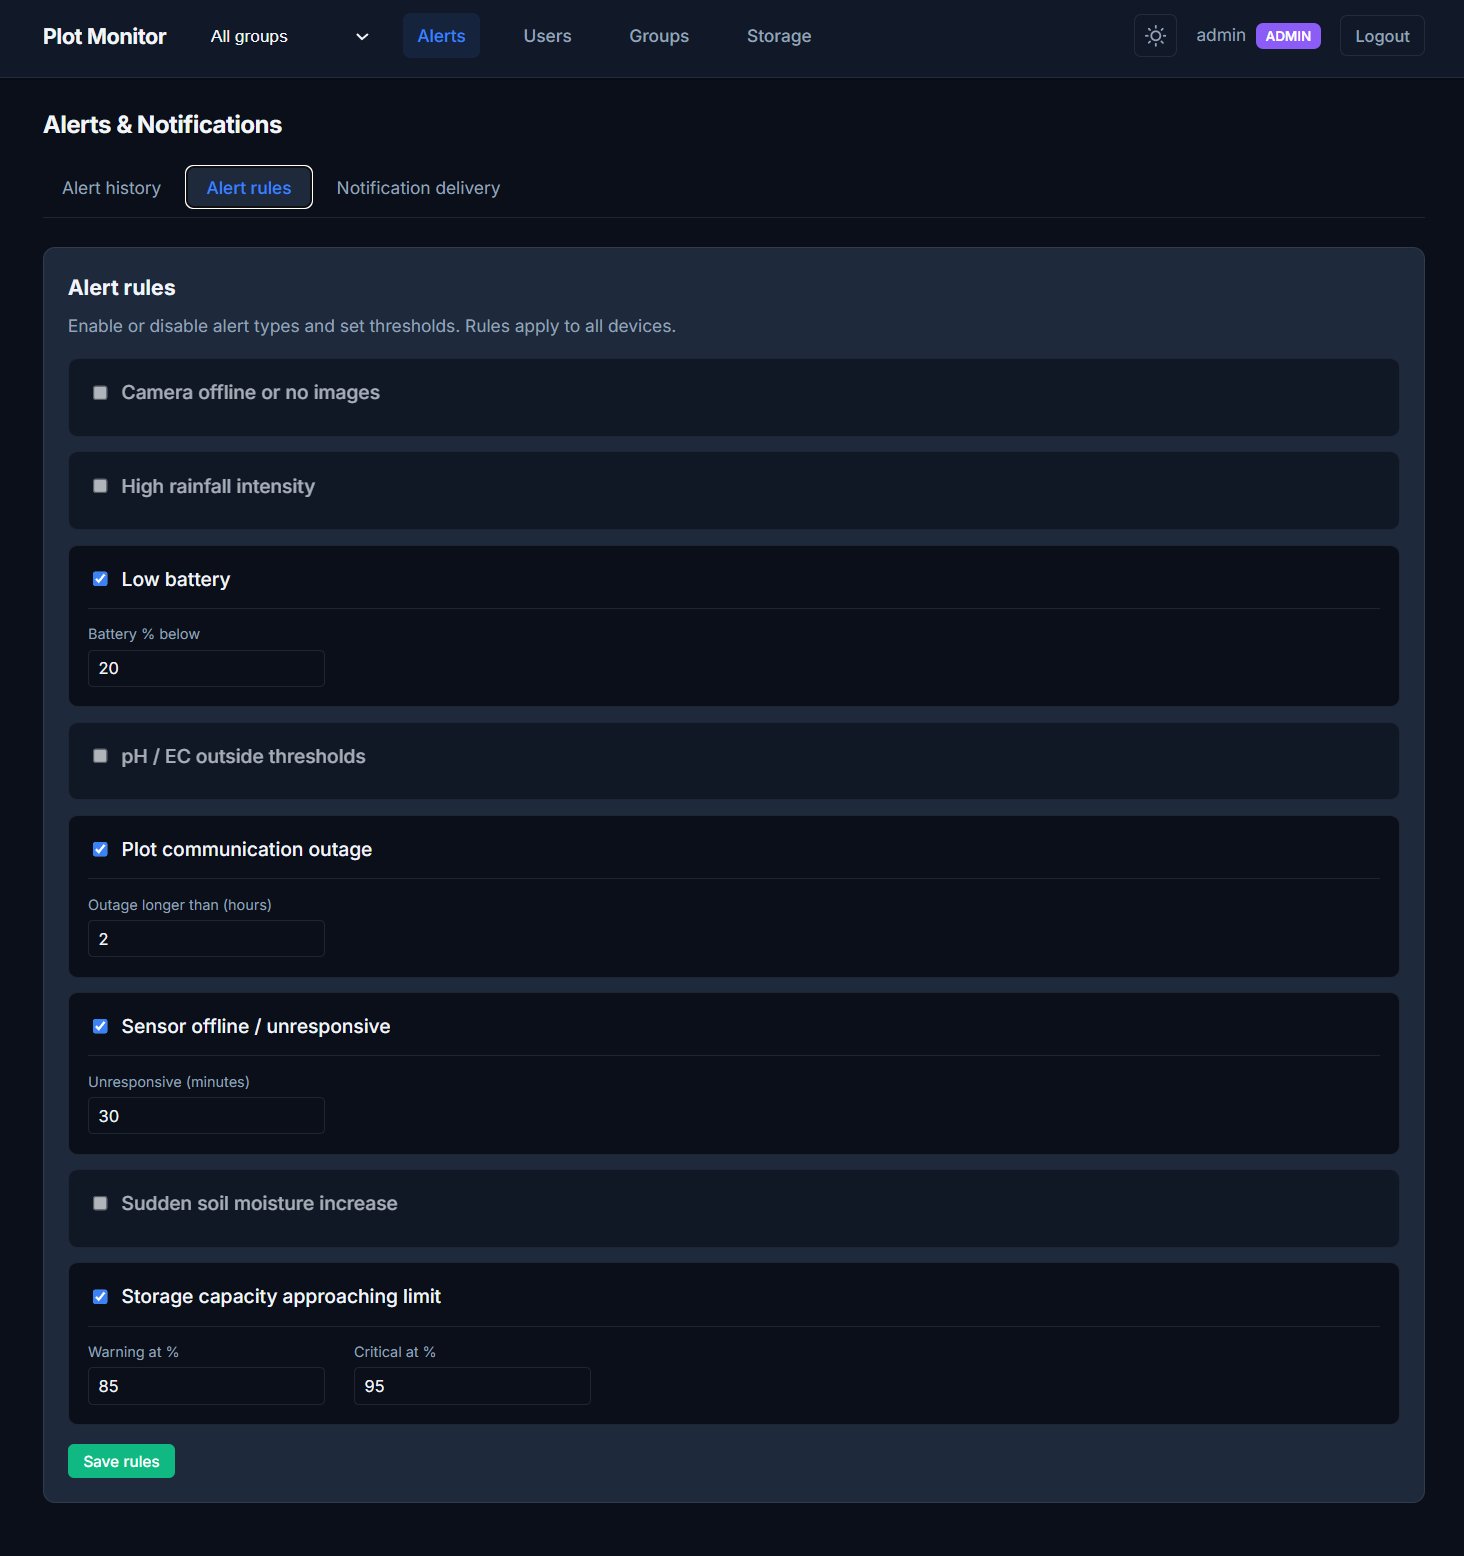
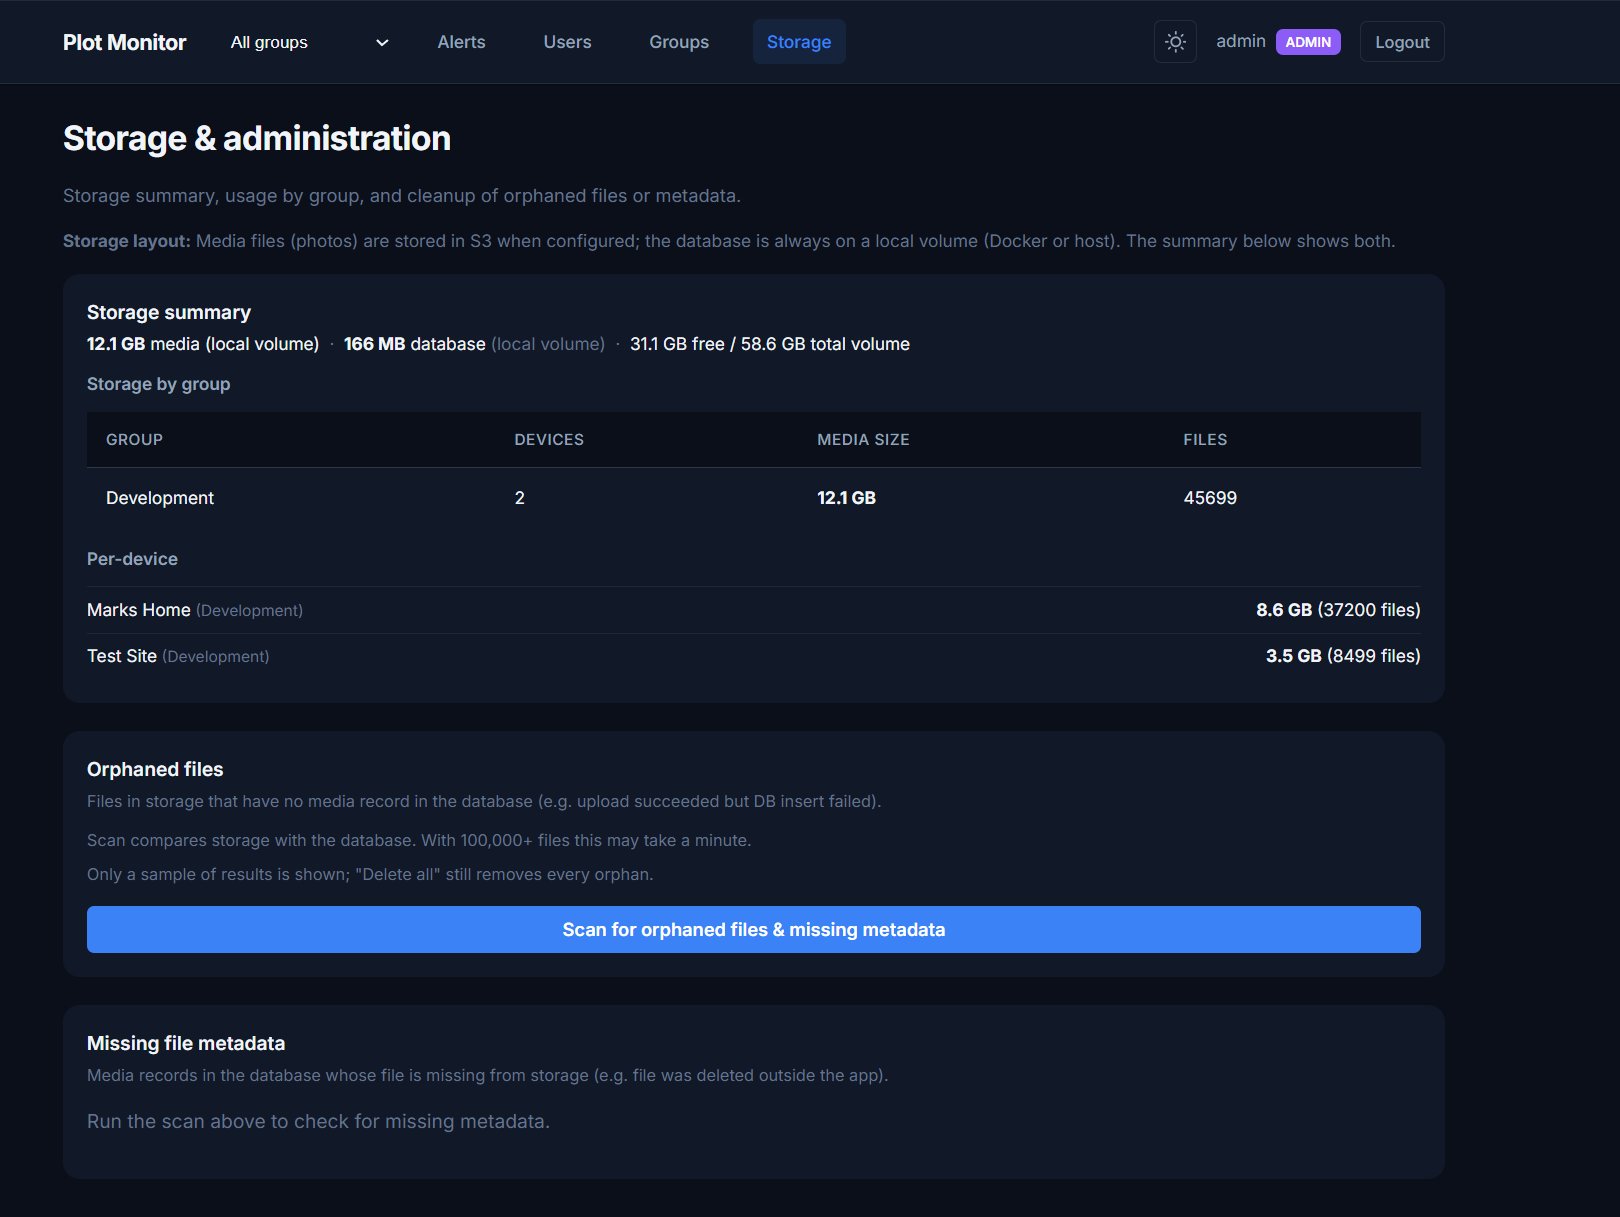
Camera feeds stream live via MJPEG with full history browsing, time-range filtering, alarm tagging, and export packs — deployments routinely manage 45,000+ images per site. Alerting covers connectivity, sensor thresholds, battery state, camera health, and storage headroom so the first person to know about a fault is your team — not a landholder three hours away.
Reid Automation Systems provides ongoing managed infrastructure under a multi-year contract: device health, updates, and incident response for units that must keep reporting long after commissioning day.
Custom Linux platform
Real-time protocol handling
Local data cache & OS
Gigabit Ethernet · USB 3.0
Battery monitoring & management
Multi-channel sensor connectivity
Sealed cable gland connectors
Full in-house design & assembly
Field System Configuration
- Solar-powered ARM Linux controller with integrated MPPT — built for off-grid, long-duration deployments
- Cellular (3G / 4G LTE) backhaul with local buffering — telemetry cached on-device and uploaded in batches when the network allows
- Multi-depth soil profiling — moisture, EC, and temperature resolved at many levels below the surface
- Rainfall and runoff monitoring — volume, pH, EC, temperature, and related hydrology channels in one integrated stack
- Dedicated sensor co-processor for real-time RS485 and multi-protocol I/O
- 1TB NVMe for on-site time-series cache, media, and OS — weatherproof enclosure with sealed sensor interface panel
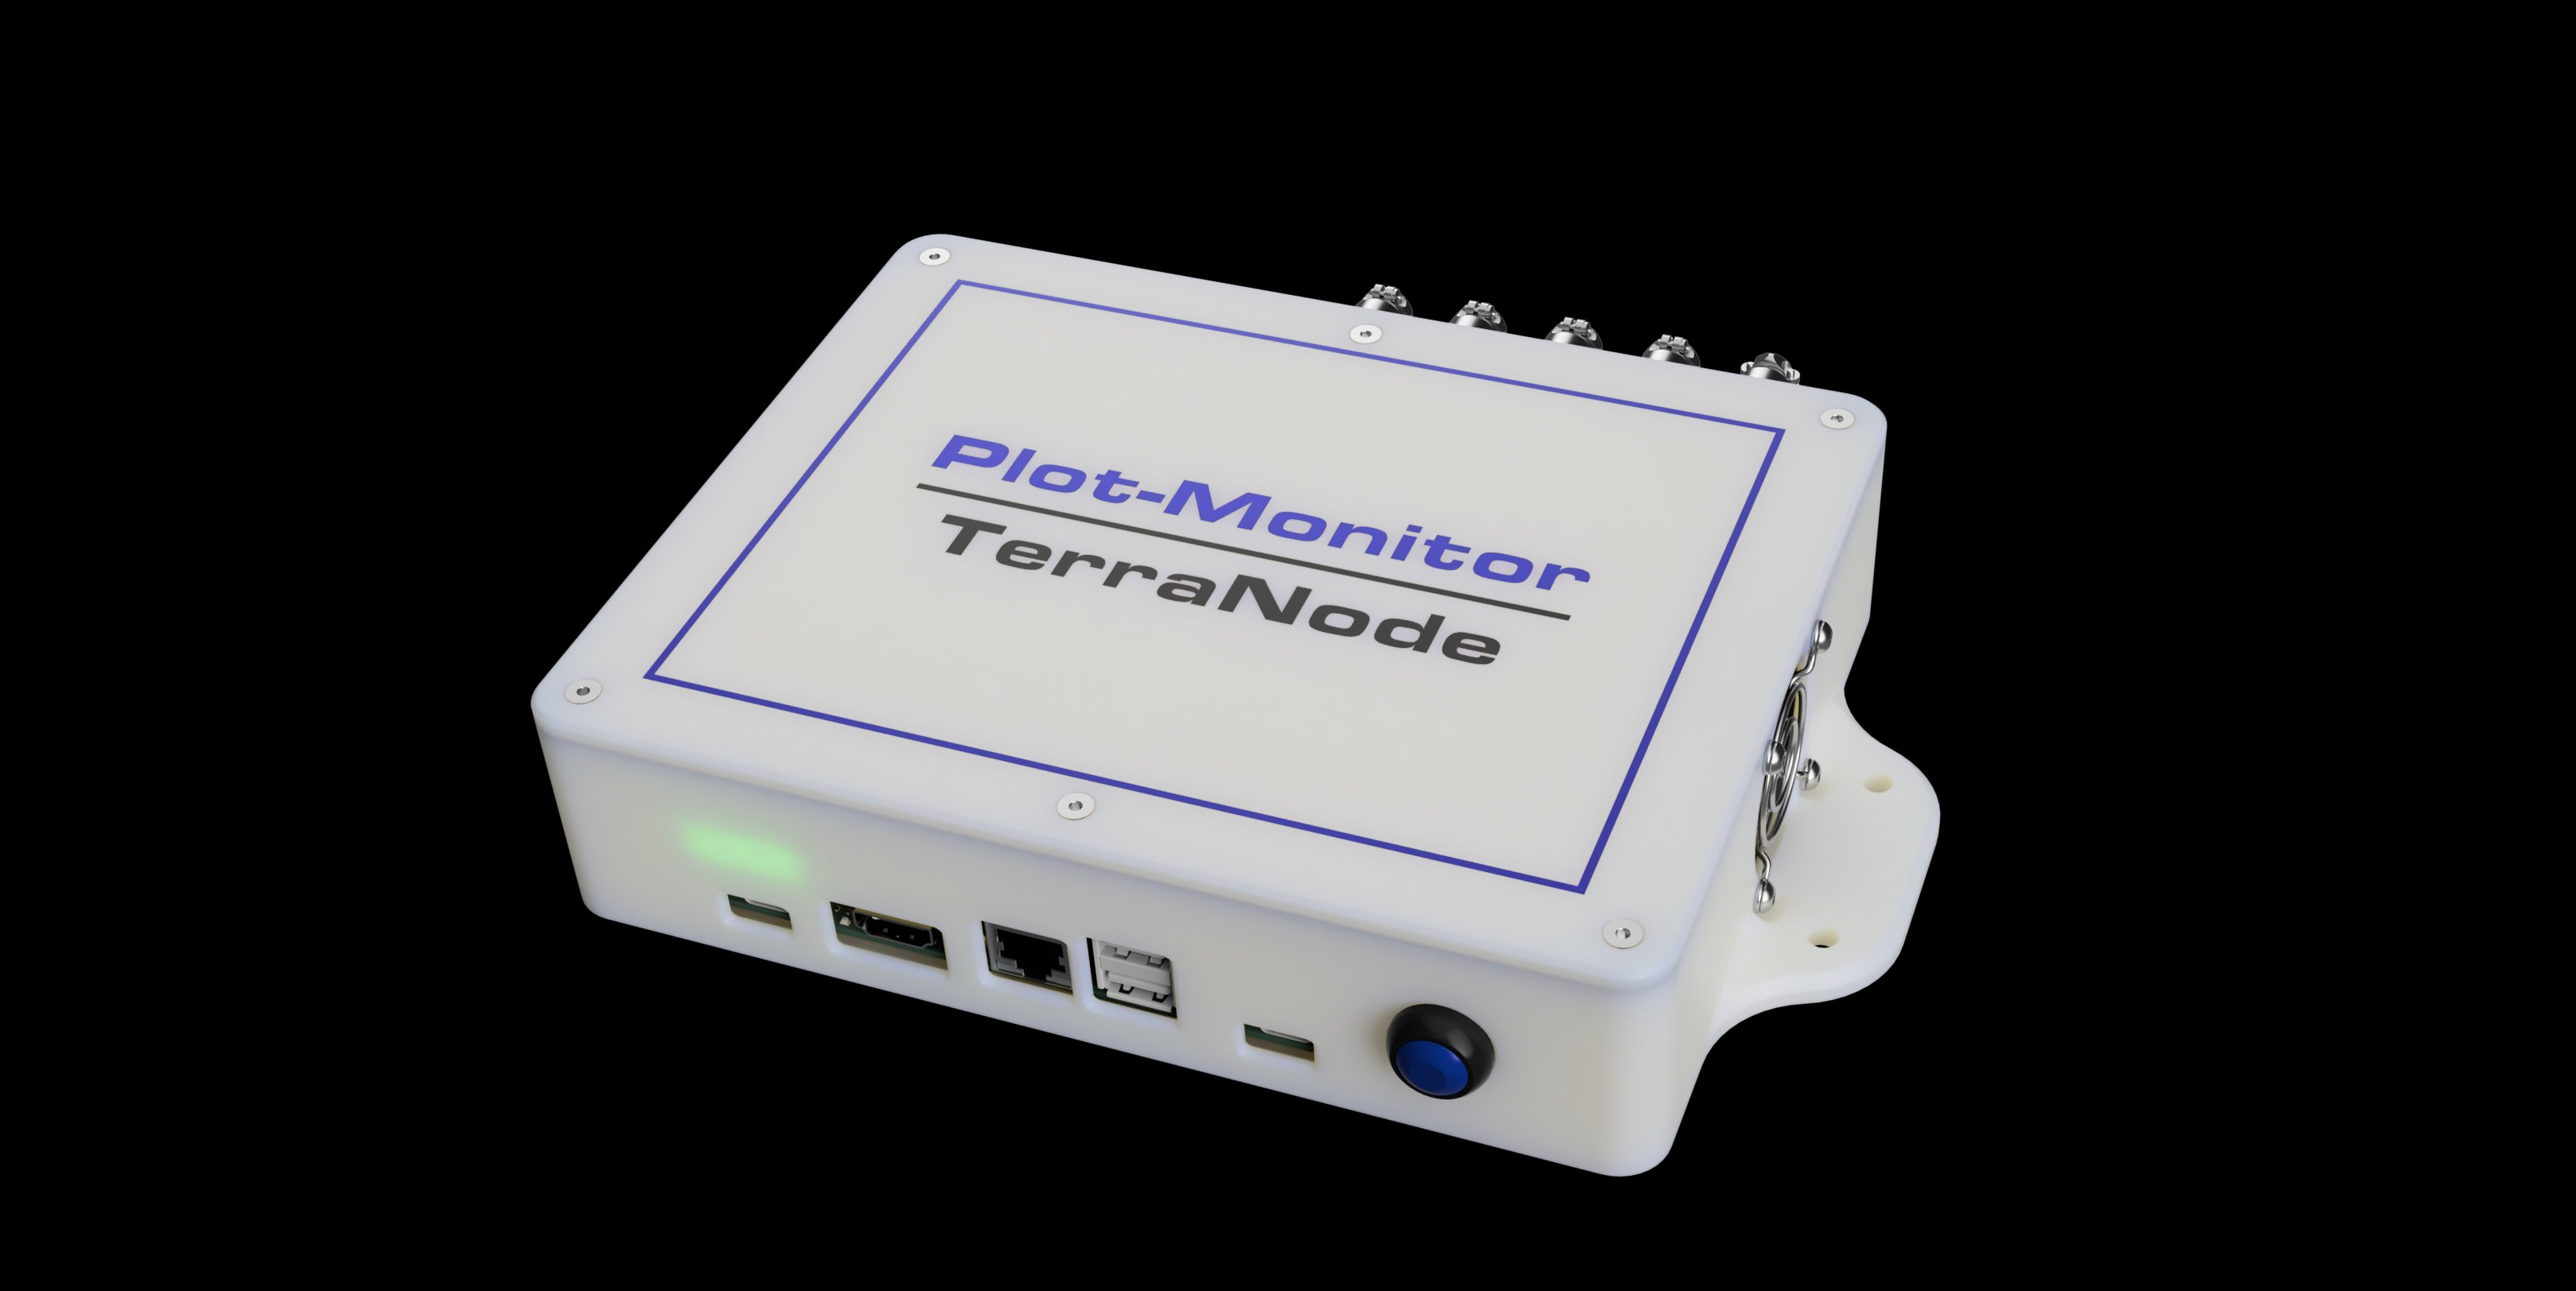
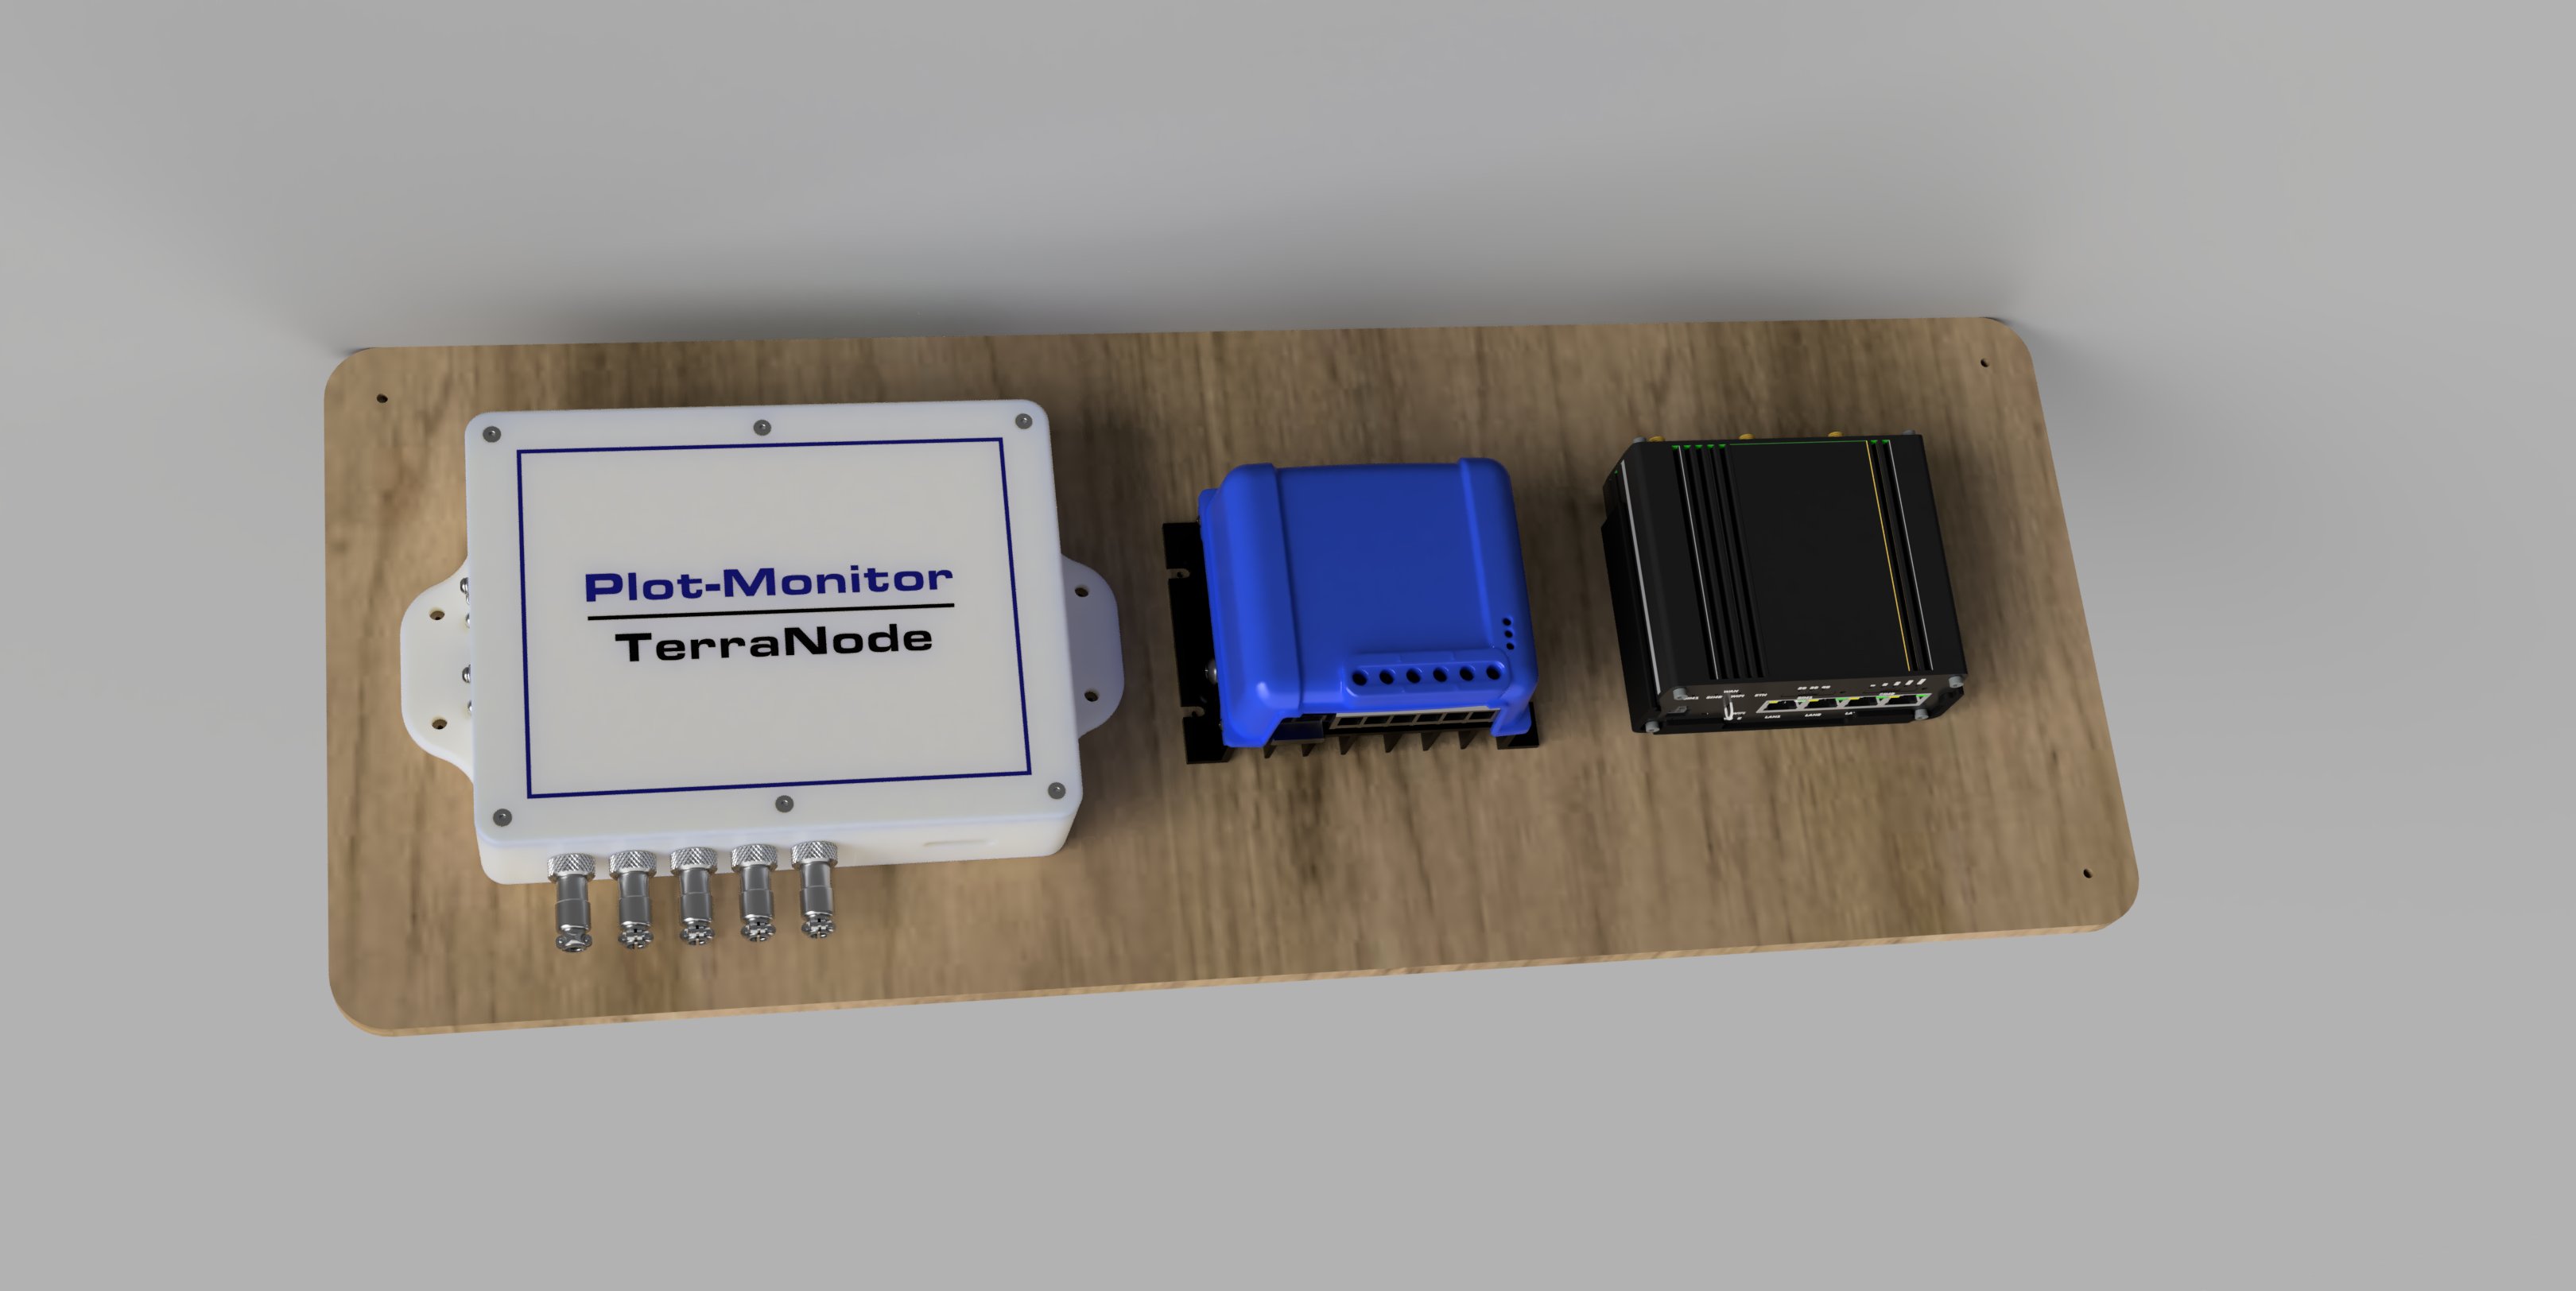
RAS-designed solar field controller — ARM Linux host, sensor co-processor, MPPT charging, 3G / 4G LTE, 1TB NVMe cache, and weatherproof enclosure for years in harsh environments.
Measurements timestamped and held locally through brownouts or absent coverage; batched, acknowledged uploads so nothing is lost when hundreds of sites post in parallel.
TimescaleDB ingestion designed for fleet-scale parallel telemetry — Docker Compose, Caddy TLS, role-based access, pluggable S3 or local media, and bulk export for science and compliance workflows.
Real-time sensor readings, configurable trend charts (1h–1y), alert rules, notification dispatch, and system status monitoring.
Interactive 3D soil profiles (depth × time × metric) — making multi-level moisture, EC, and temperature arrays legible at a glance alongside runoff and weather context.
Live MJPEG streaming, alarm-tagged history browser, time-range filtering, export packs, and 45,000+ image management per deployed site.
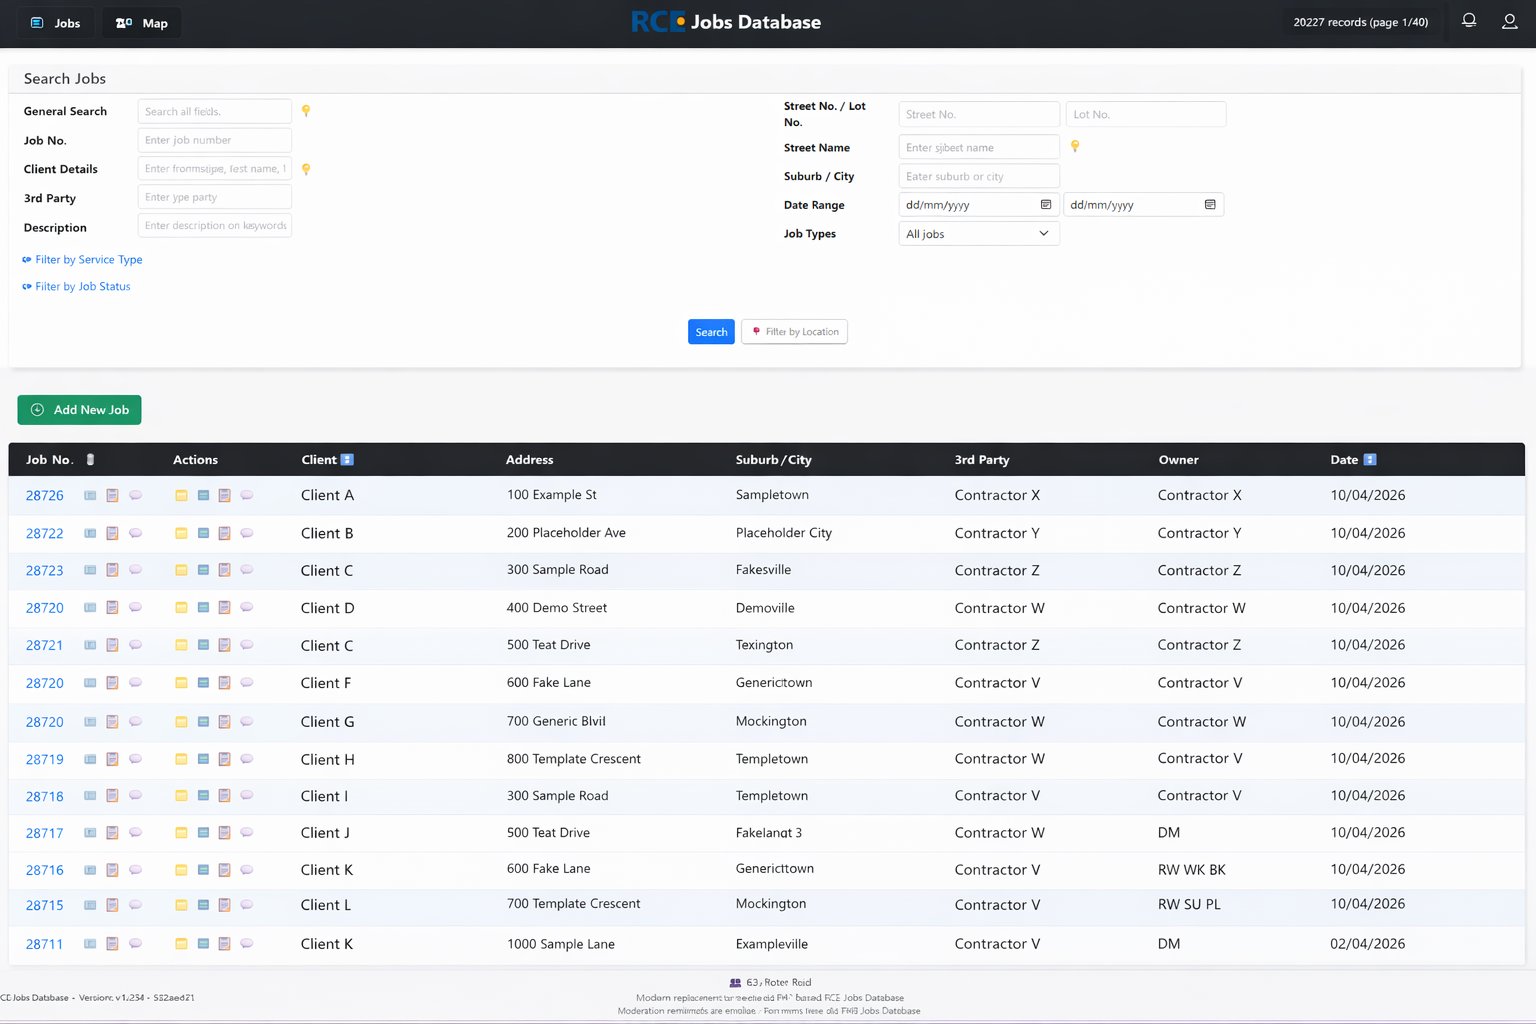
A bespoke, fully integrated engineering workspace — consolidating job management, geospatial analysis, council GIS data, LiDAR terrain modelling, document generation, and field photo management into a single purpose-built application.
Off-the-shelf tools couldn't meet the breadth of this engineering consultancy's needs — so we built the entire platform from scratch, purpose-designed around how their team actually works. The result is a unified office environment replacing five or six separate applications with one cohesive system.
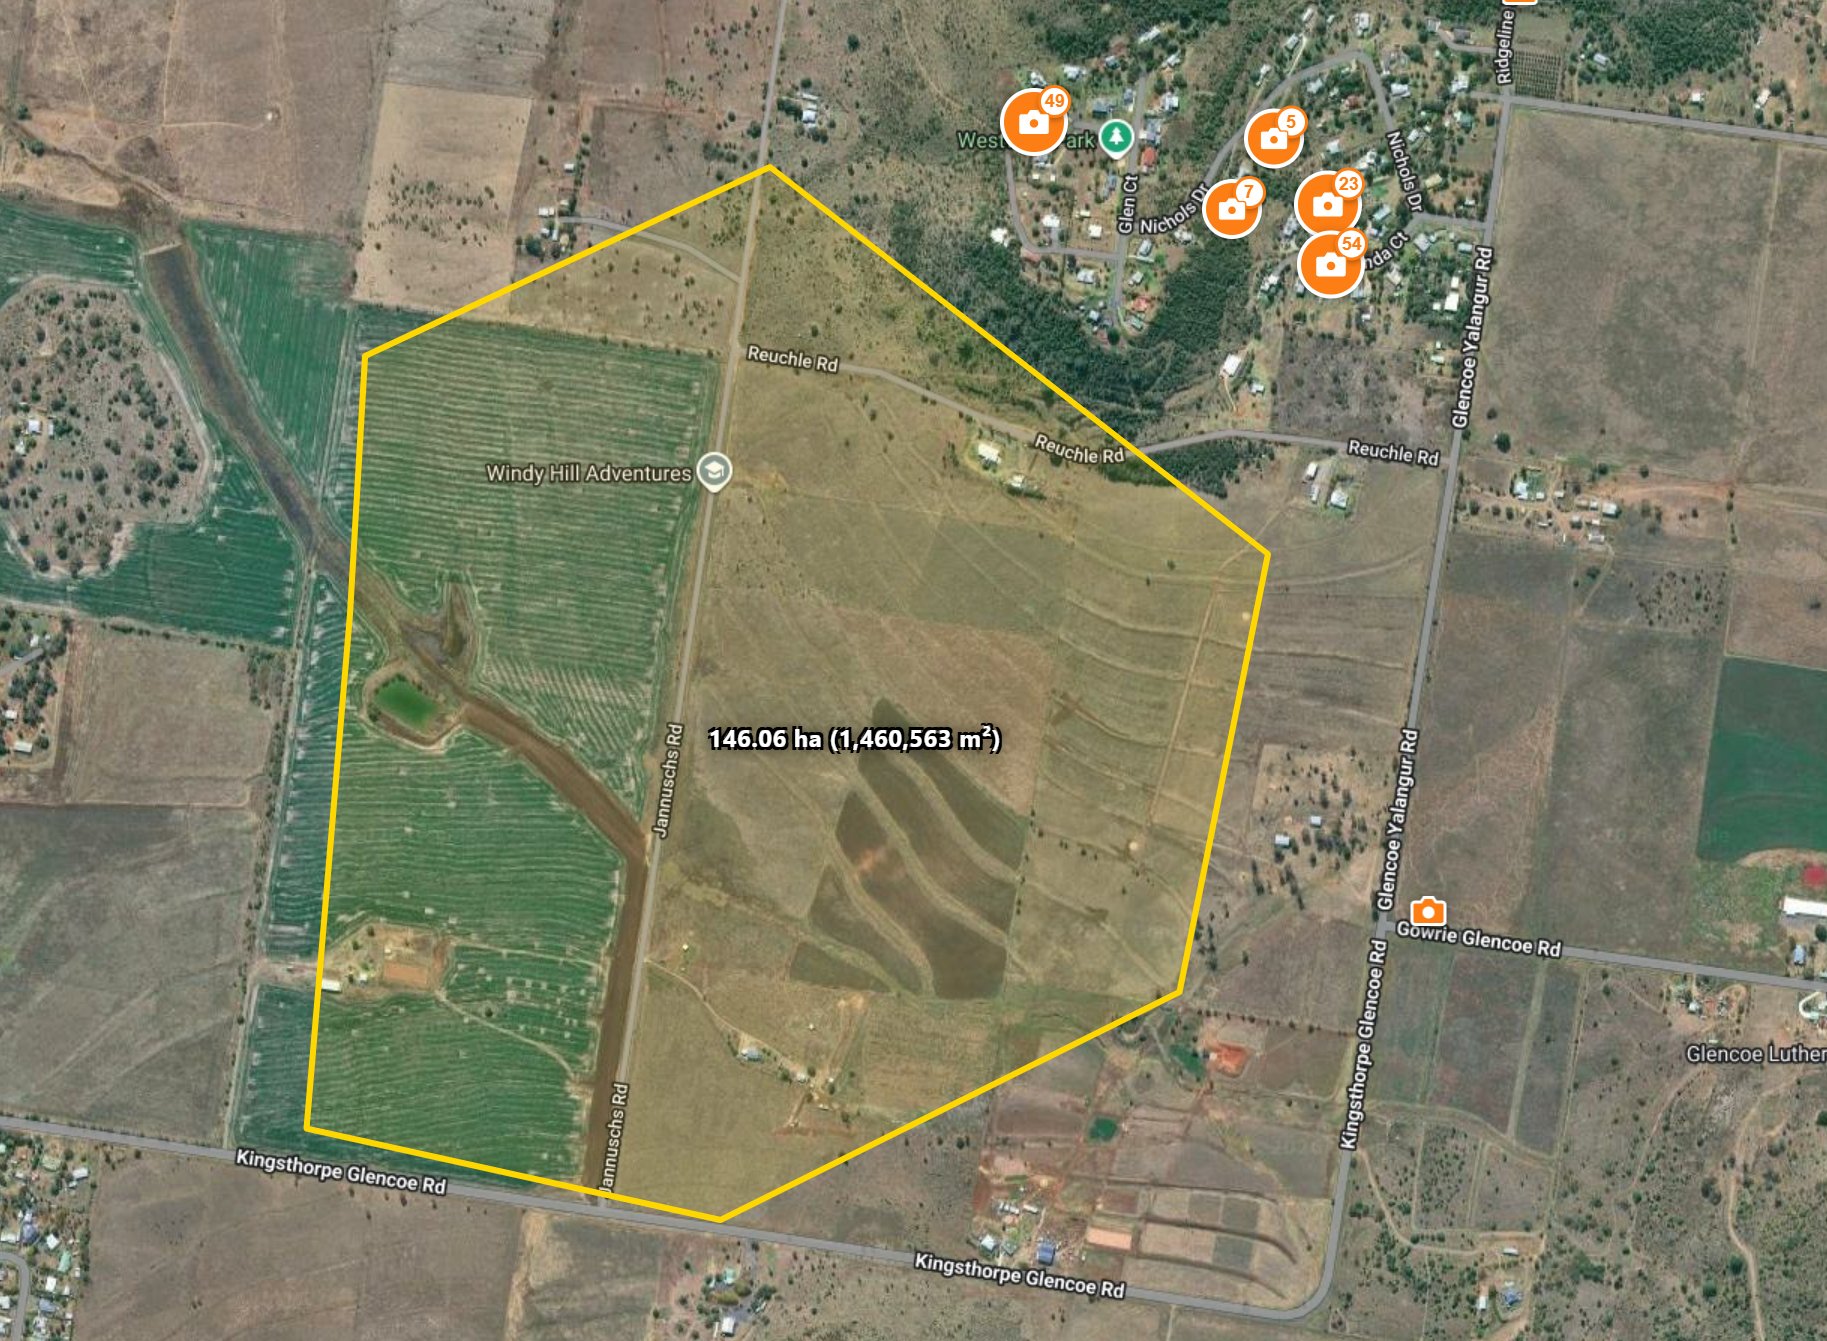
A custom mapping framework unifies multiple sources — OpenStreetMap, Esri, Google Maps, Queensland Government imagery, and local council tile layers — into a single seamless interface. Engineers overlay live council infrastructure data (water, sewer, stormwater, electrical grid, boundaries, easements, flood hazard, and more) directly on the map in one click.
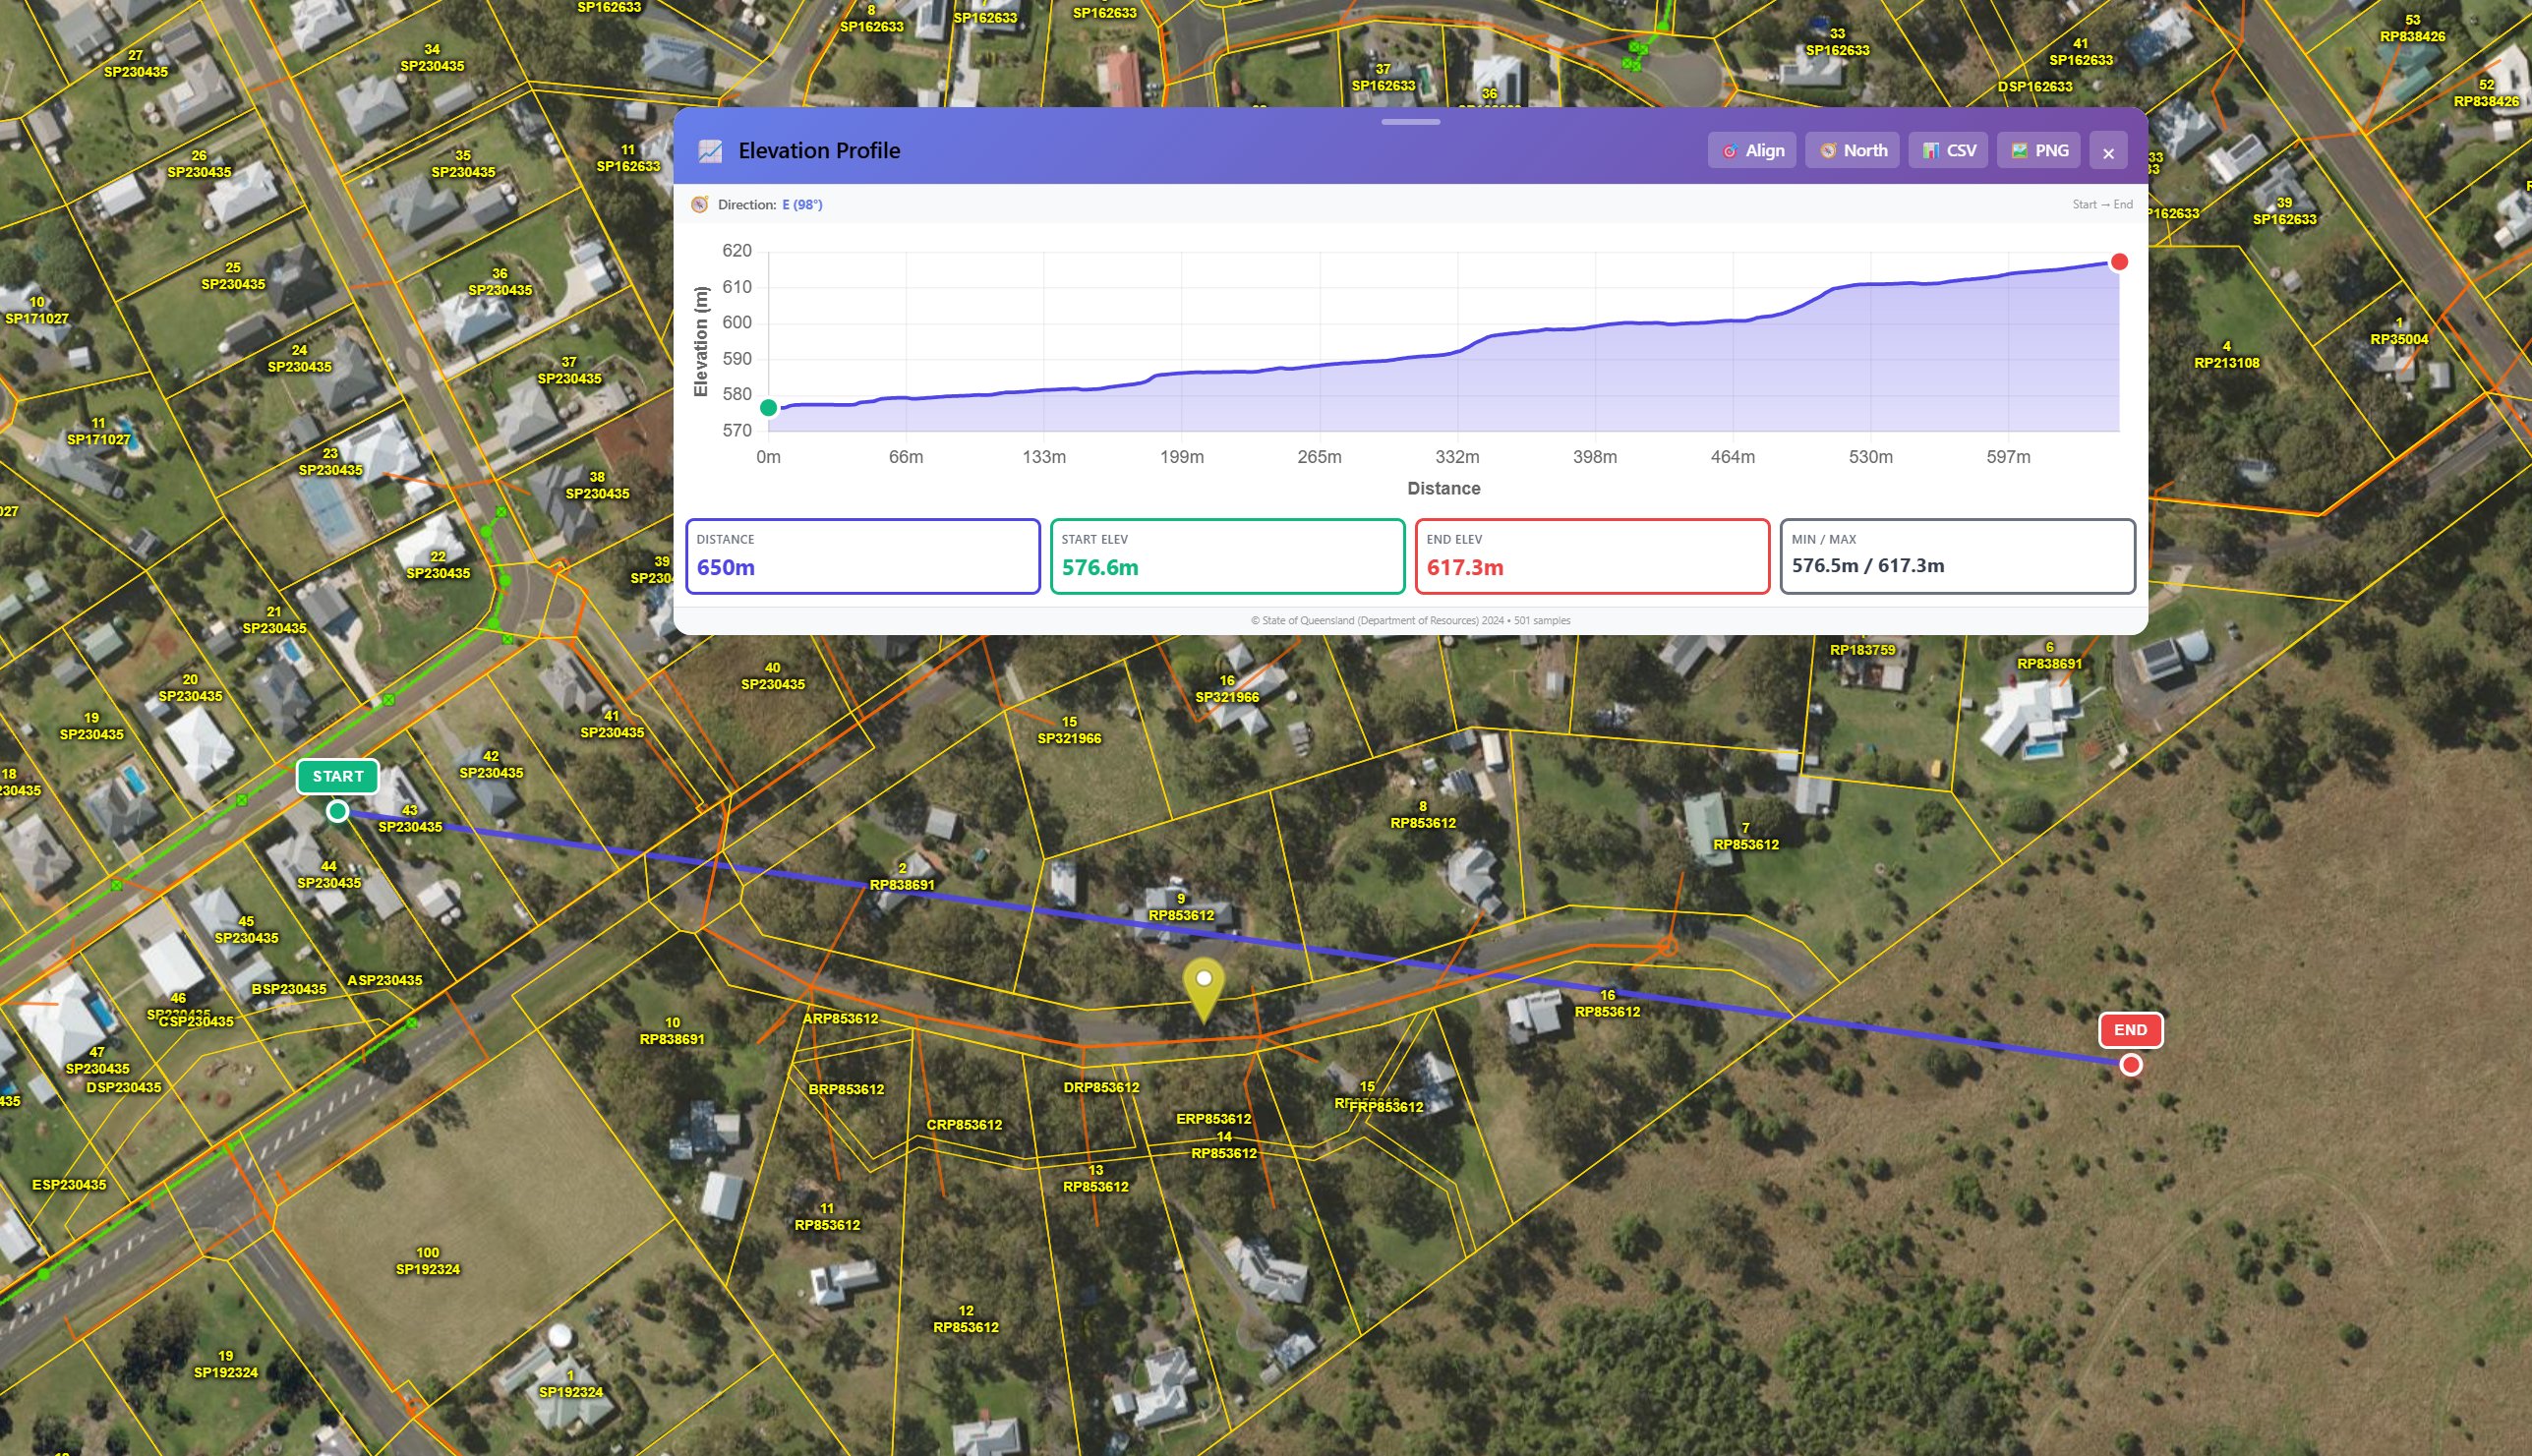
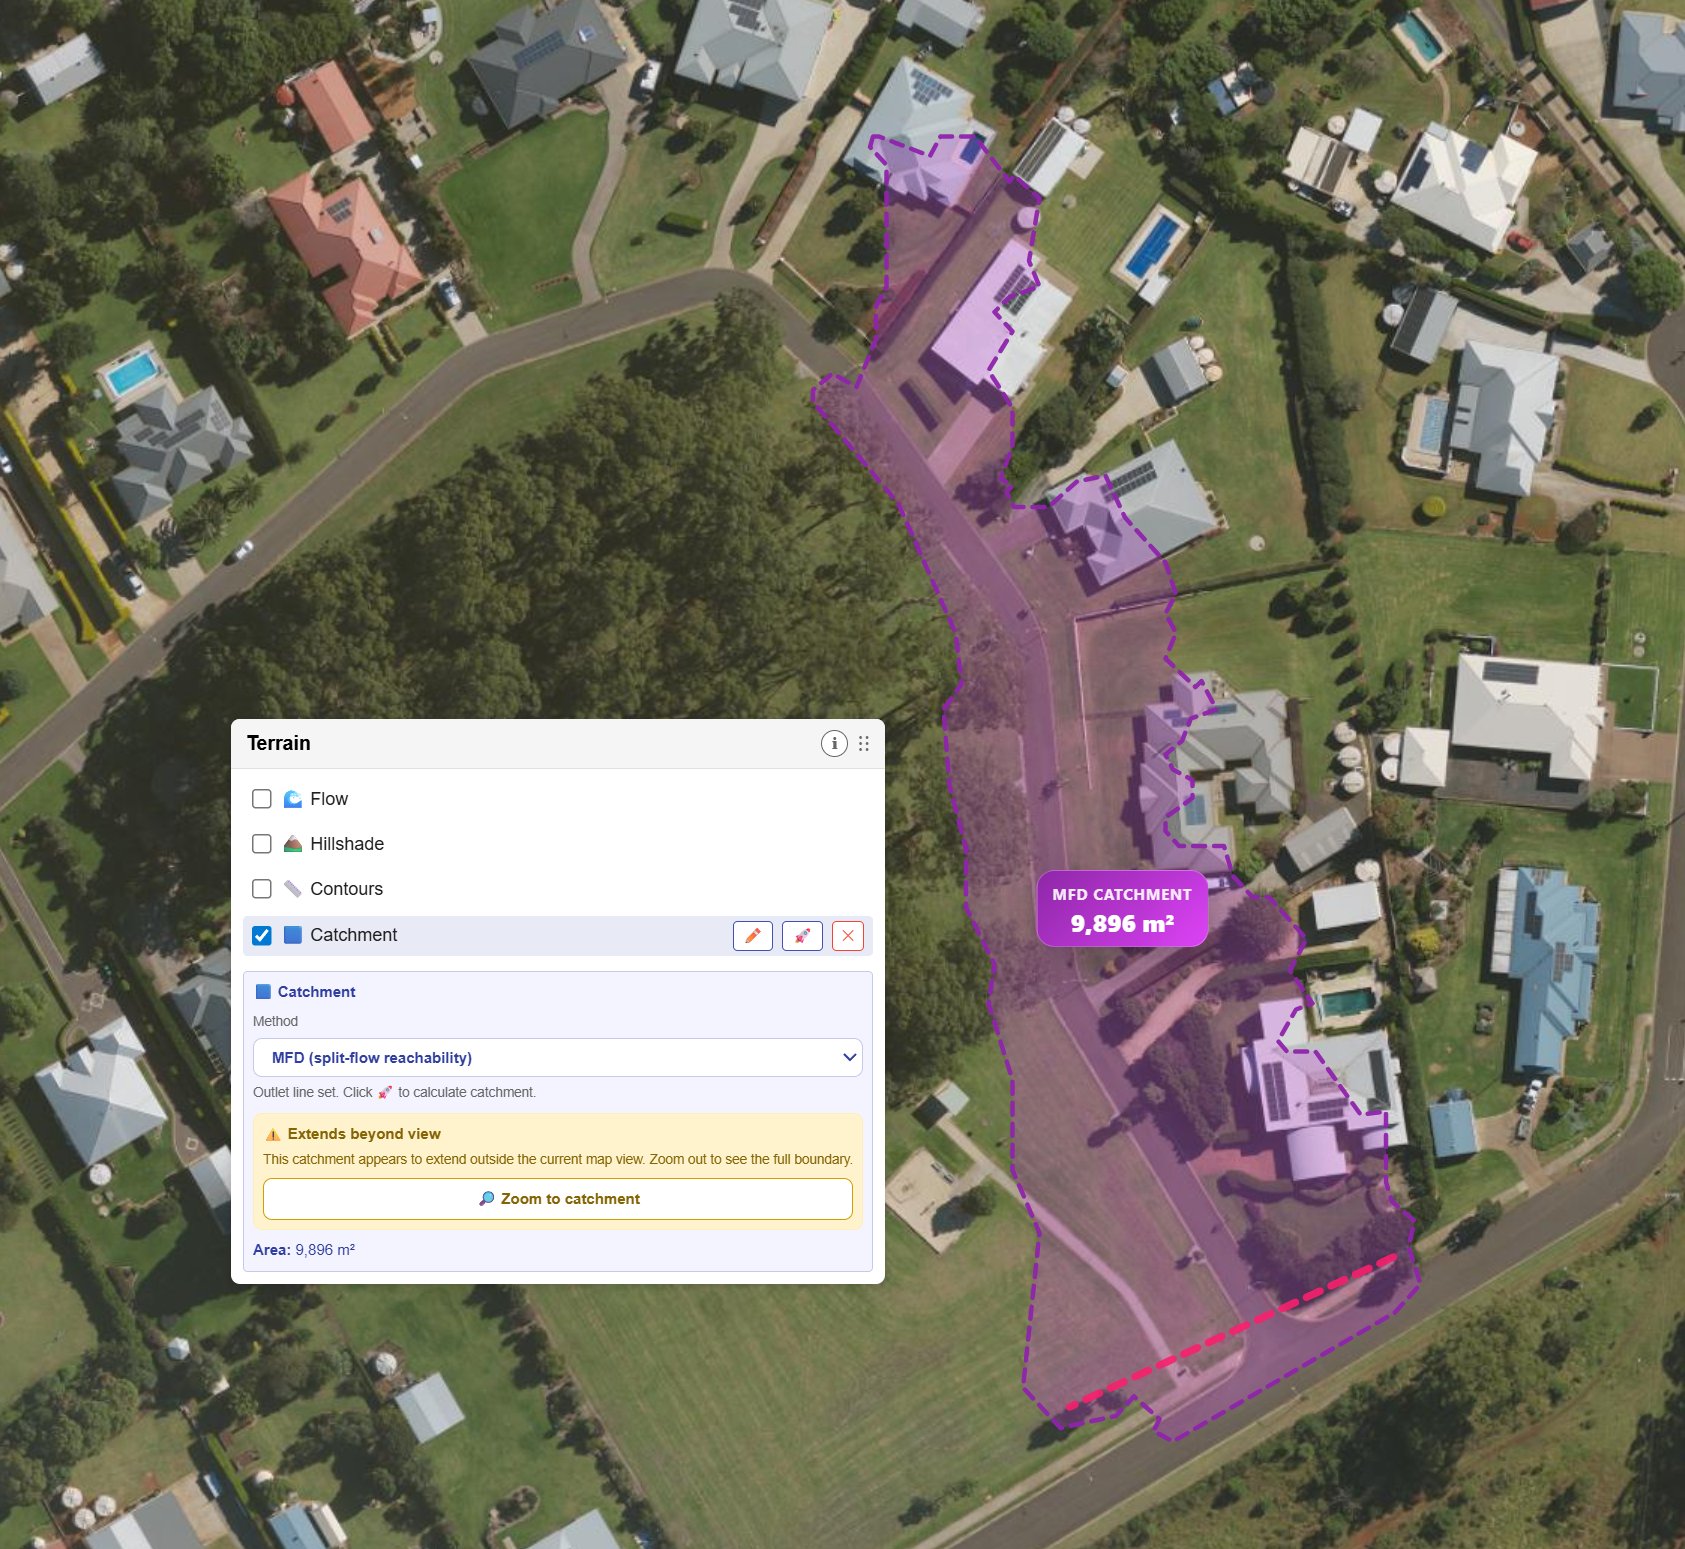
The terrain analysis capability sets the platform apart. Using Queensland's 1m LiDAR DEM dataset, the system automatically generates elevation cross-sections, calculates catchment areas using hydrological flow modelling, and produces stormwater runoff analysis — all within the browser, tied directly to the active job.
The job management core tracks 20,000+ records with multi-field search, geocoded map discovery, client CRM, automated document generation, photo layout reports, Google Street View integration, and real-time multi-user collaboration via WebSocket.
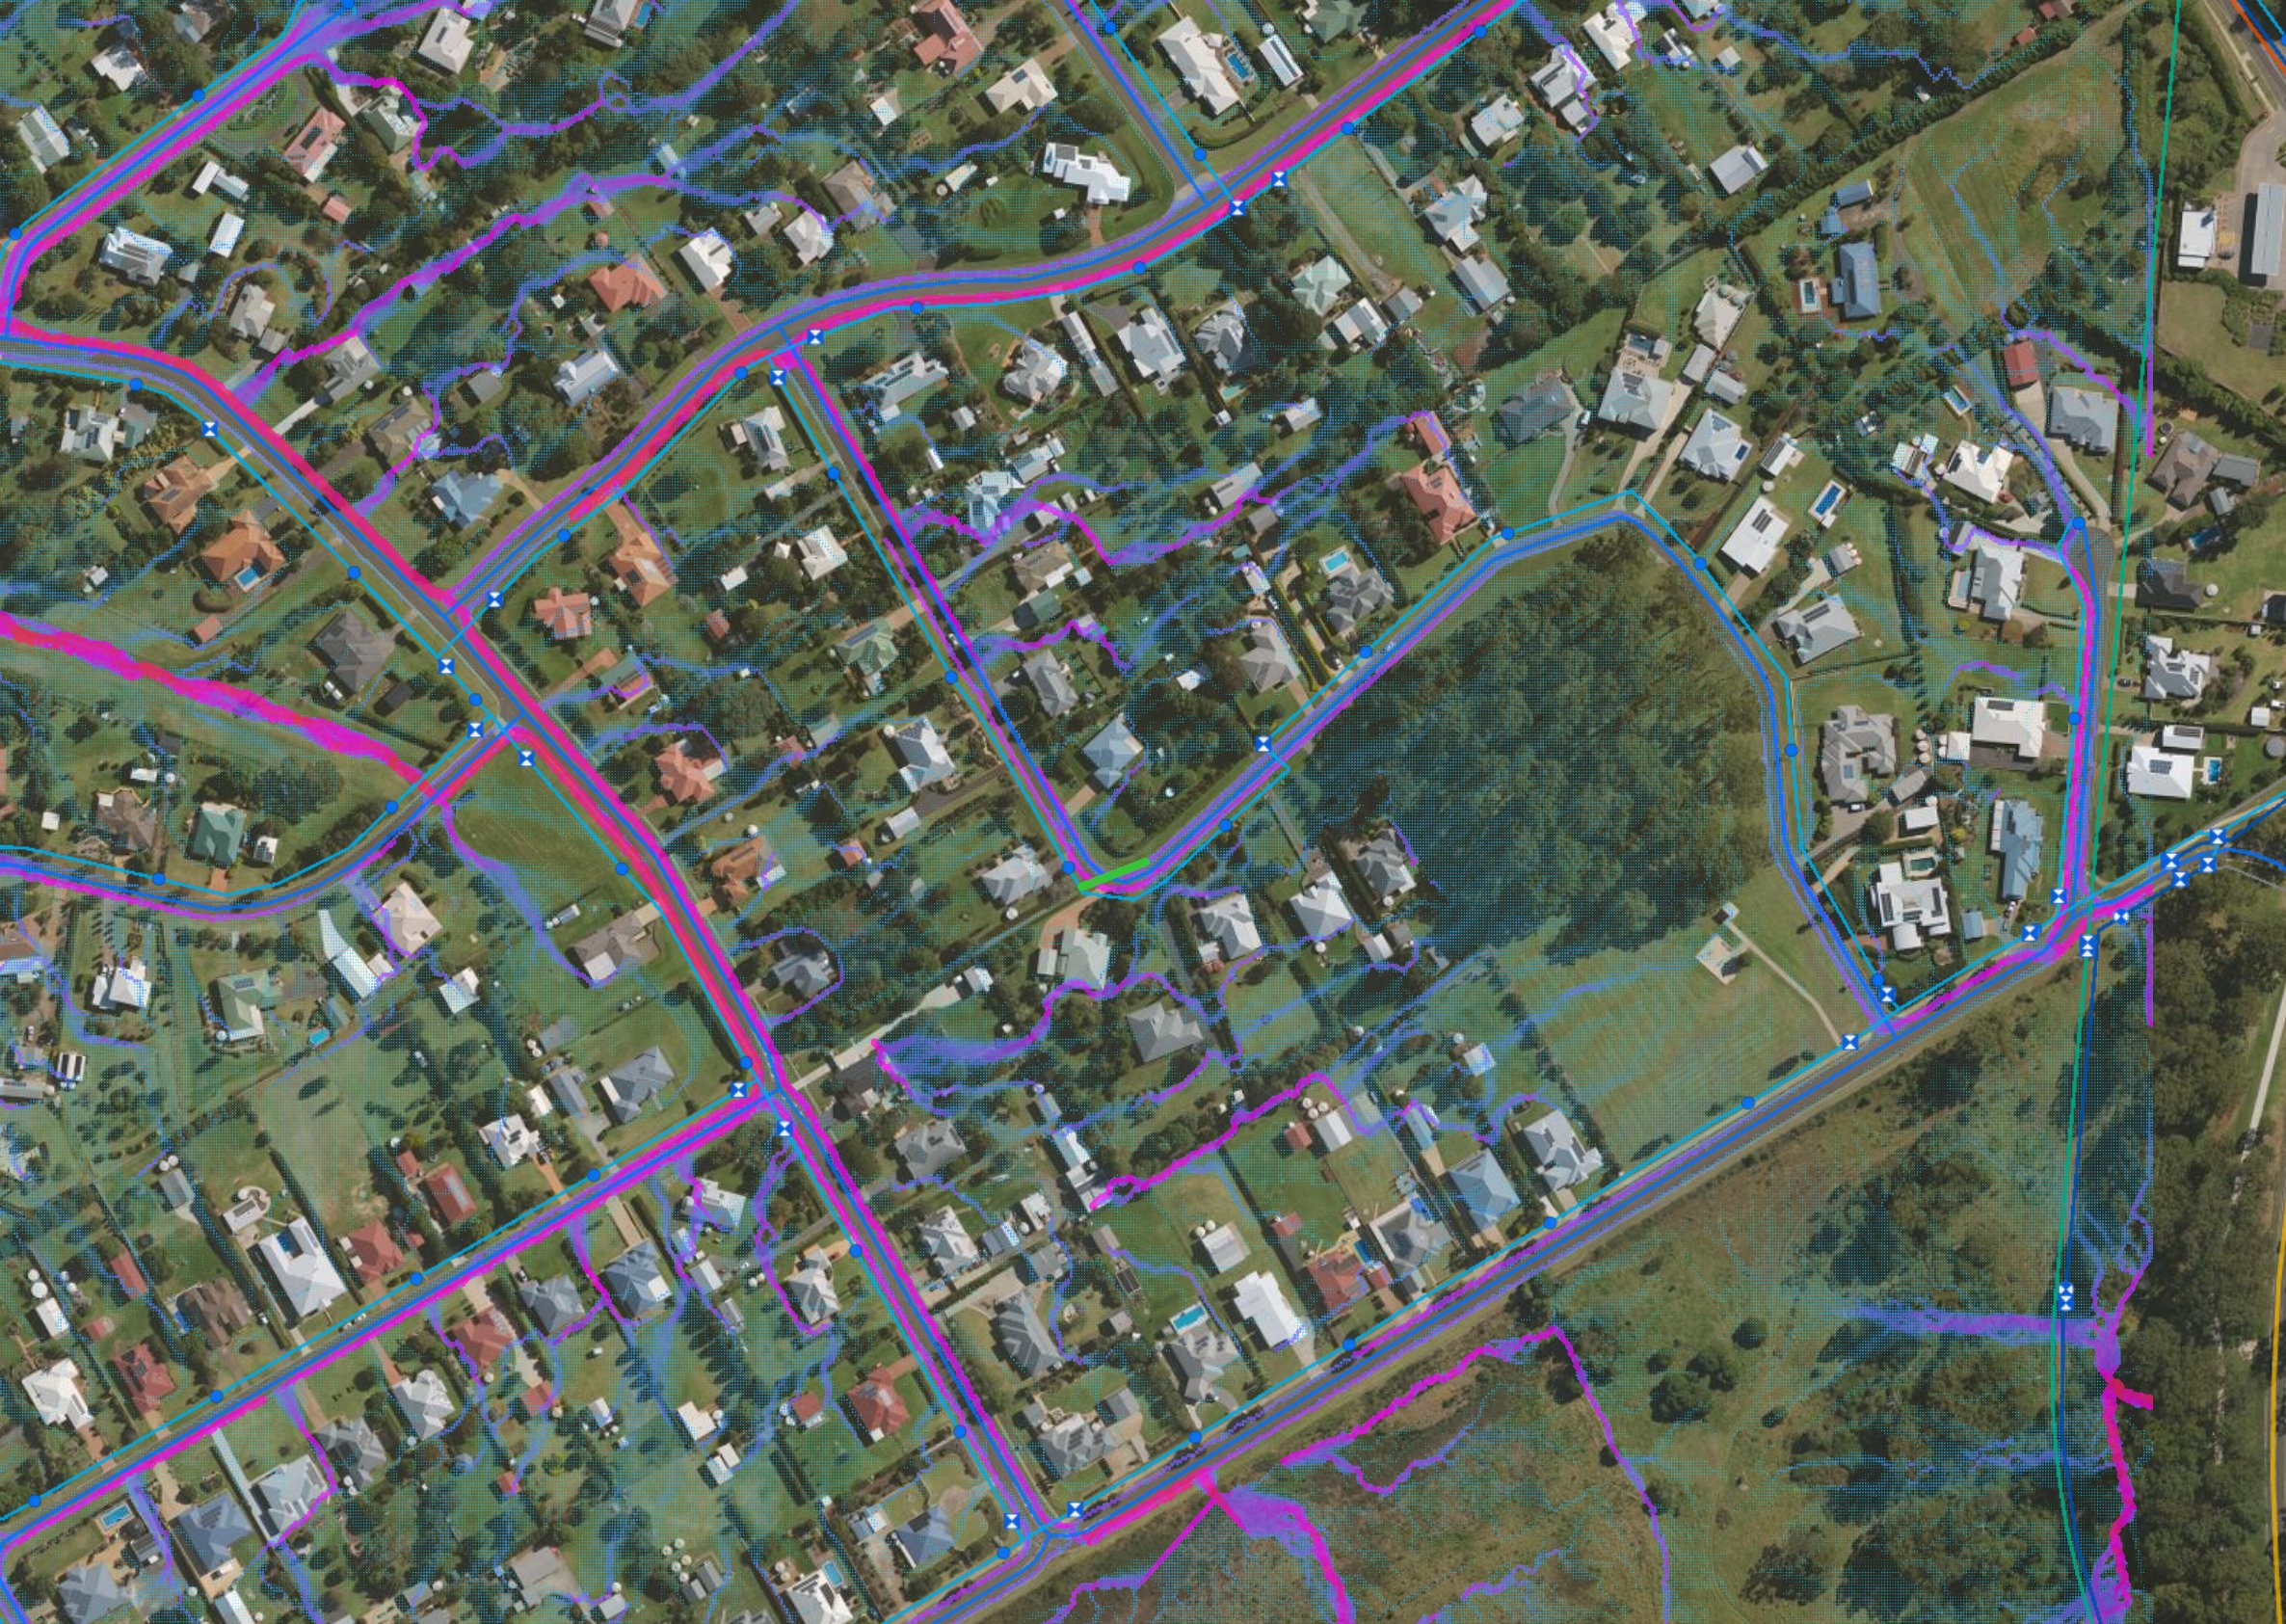
10+ map sources in one interface — OSM, Esri, Google Maps, QLD Government imagery, and council-specific tile layers, switchable in one click.
Live overlay of water, stormwater, sewer, electrical grid, land parcels, boundaries, easements, flood hazard, landslide risk, land use zones, and development applications.
Automated elevation profiles, catchment delineation, flow path modelling, and runoff calculations from Queensland's 1m LiDAR DEM — generated on demand in-browser.
Full lifecycle tracking, client and contractor CRM, multi-field search, location-based discovery, and automated numbering across 20,000+ records.
Template-driven Word and Excel generation, automated photo layouts, map-clustered field photos, and Google Street View integration.
Area measurement, boundary search, distance and peak-hour travel time, property queries, and export to CSV and PNG — all map-integrated.
A production web application for running a serious 3D printing operation — not a spreadsheet bolt-on. Filament Tracker maintains full spool-level inventory: where each roll lives, how much remains, what it cost, and the preparation rules operators actually need before a print starts.
The interface is built around dense, scannable card and table views with powerful filtering by brand, material family, storage location, and format. Each spool carries drying guidance (temperature, duration, required vs recommended), desiccant expectations during use, and nozzle-size compatibility — including explicit warnings where materials are not suited to automated multi-material systems.
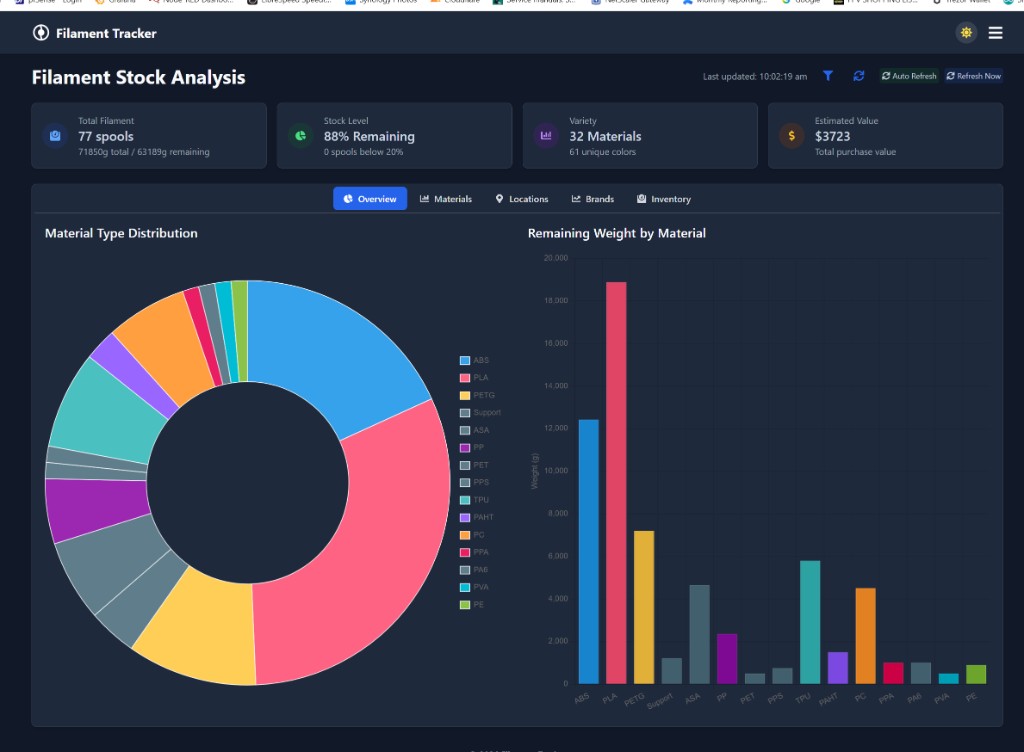
Remaining material is tracked as both weight and percentage, with visual progress and aggregate roll-ups so you can see total stock, remaining grams, and inventory value at a glance. Auto-refresh and manual sync keep the floor view aligned with reality.
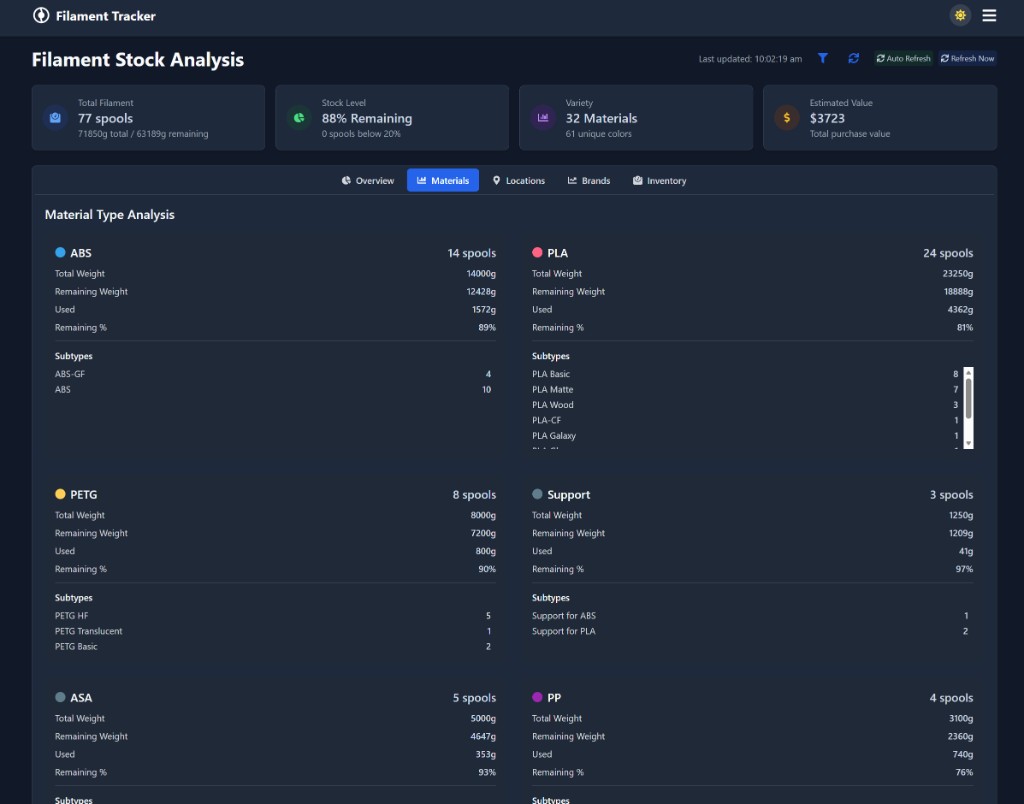
Usage is tied to print jobs so consumption moves the numbers automatically instead of relying on manual adjustments after every run. Analytics break down the library by material type, location, and brand — from everyday PLA and PETG through engineering grades and support materials — giving you a clear picture of variety, burn-down, and carrying cost.
Filament Tracker demonstrates how we approach internal tools with the same rigour as client delivery: domain-shaped UX, data integrity, and an interface operators will actually keep updated.
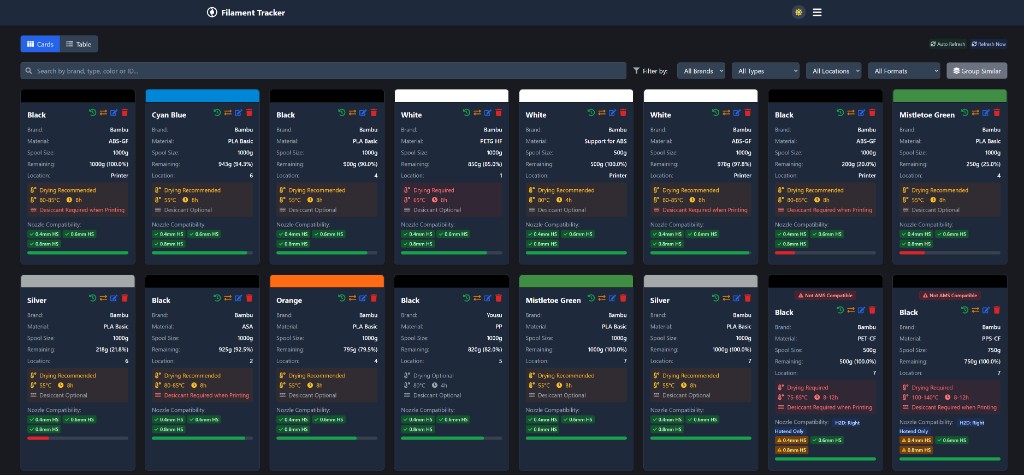
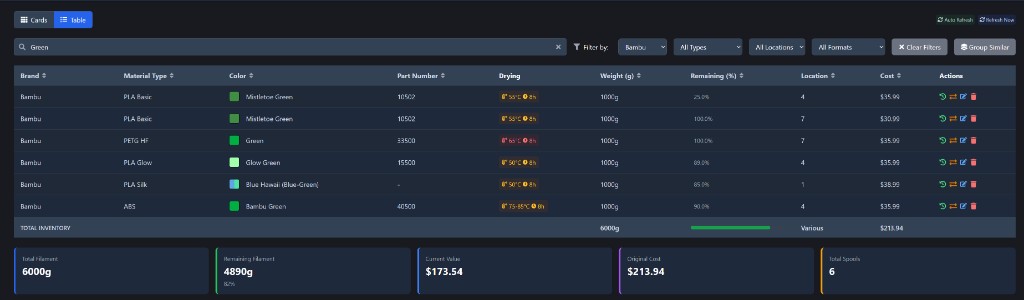
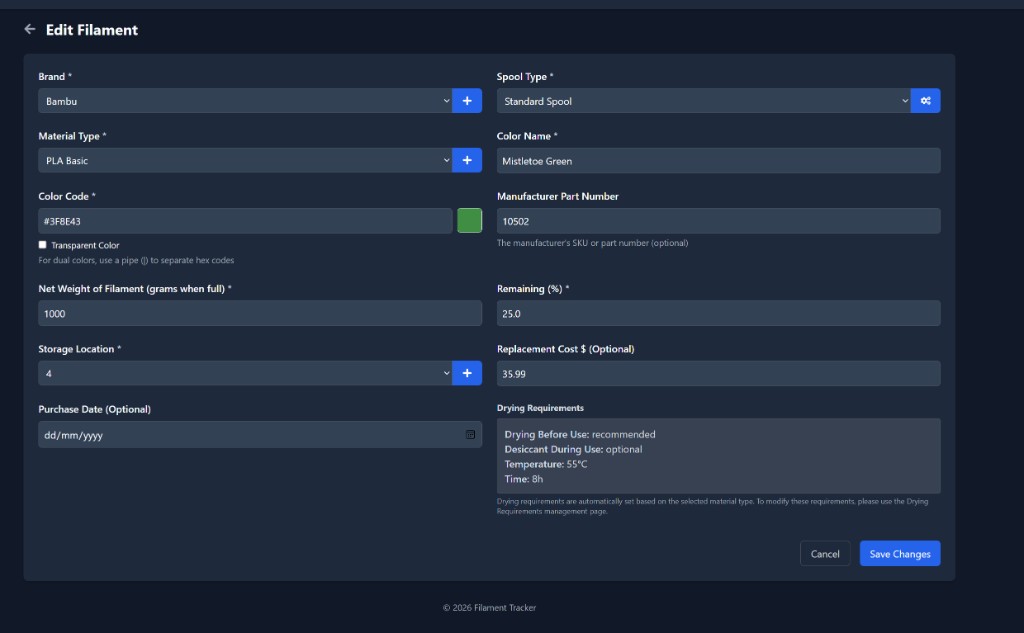
Every roll tracks location, remaining mass and percentage, purchase cost, and replacement value — with card and table paradigms for different workflows.
Consumption flows from completed jobs so inventory stays honest without double-entry between slicer logs and a side spreadsheet.
Drying and desiccant prompts, nozzle compatibility, and AMS / hardware cautions surfaced where operators look before starting a job.
Dashboards for material mix, remaining grams by family, spool counts, and total carrying cost — supporting purchasing and shop discipline.
Search and multi-axis filters across brands, types, locations, and formats — built for libraries that span dozens of materials and colours.
Dark-mode, information-dense layouts with refresh controls and grouped views — designed for repeated daily use on the workshop floor.